WhatPulse Is A PC Usage Monitor With Network, Mouse, Keyboard Stats & Heat Maps
Have you ever wanted to find out how much time you spend on the internet, how many words you typed in a day, or where you clicked on your screen? WhatPulse for Windows does all that and more. It’s a feature-rich program that monitors your keyboard and mouse usage, network bandwidth, and sends these statistics to a web portal, allowing you to analyze your computing life in the simplest way. This also allows you to compete with others by comparing these statistics with other WhatPulse users.
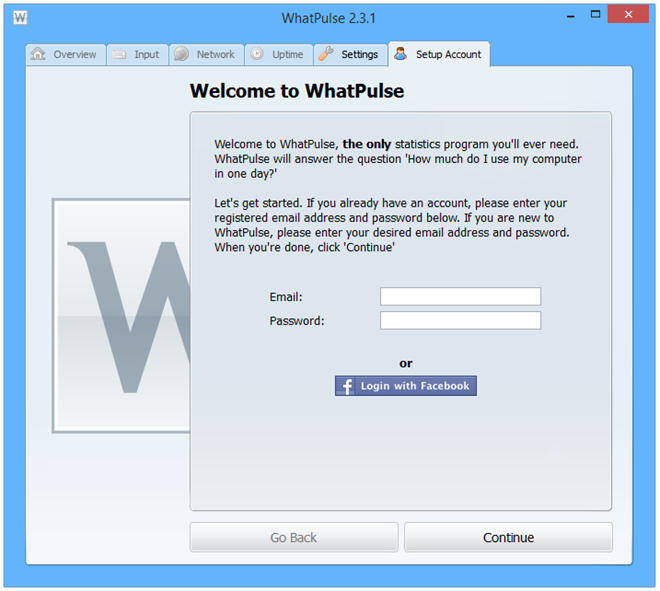
The WhatPulse interface is divided into Overview, Input, Network, Uptime, Settings and Setup Account tabs. The last one, Setup Accounts, is the tab that greets you when the app is launched for the first time. You might have guessed by now that you will need to create an account first in order to upload your stats. Luckily, you can speed things up by signing in through using your Facebook account. When you’re signed in, the remaining tabs are unlocked.
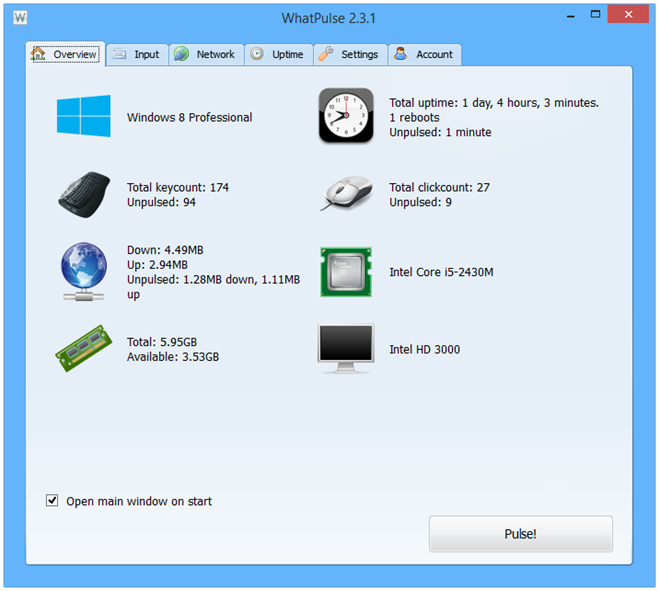
The Overview tab gives you a birds-eye view of all the different information it’s gathered about your machine, for instance, the Windows version installed on your PC, processor model, RAM, GPU, total click counts, keystrokes and bandwidth usage. Clicking ‘Pulse’ under here uploads the gathered data to an online server.
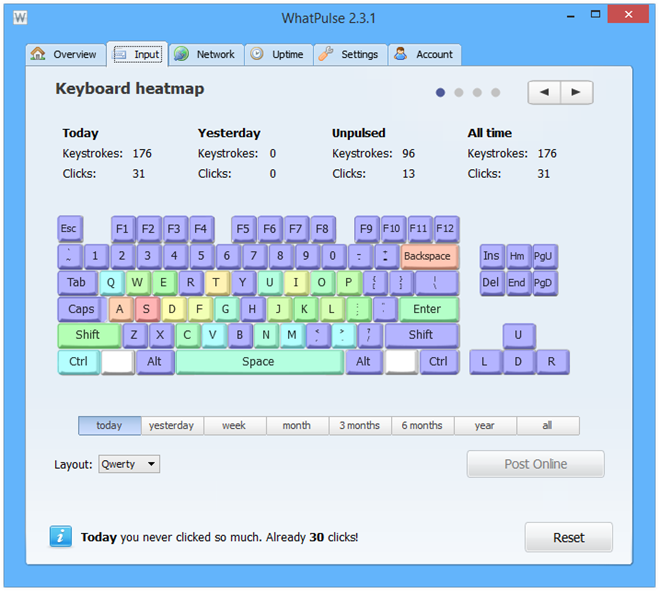
For further details, you can, of course, switch to each category’s pertaining tab. For example, the Input tab shows you the amount of key strokes and clicks your PC has registered during a certain time period. The time period can be sorted on a daily, weekly, monthly, yearly and all-time basis. The ‘all’ setting will show stats since the program was installed, of course.
Below the keystrokes, you’ll find a keyboard heat map, which basically uses light and warm colors to shows what keys were used more than others during the selected time period, as shown in the screenshot below. Below that, the app displays the total amount of clicks registered in the current day.
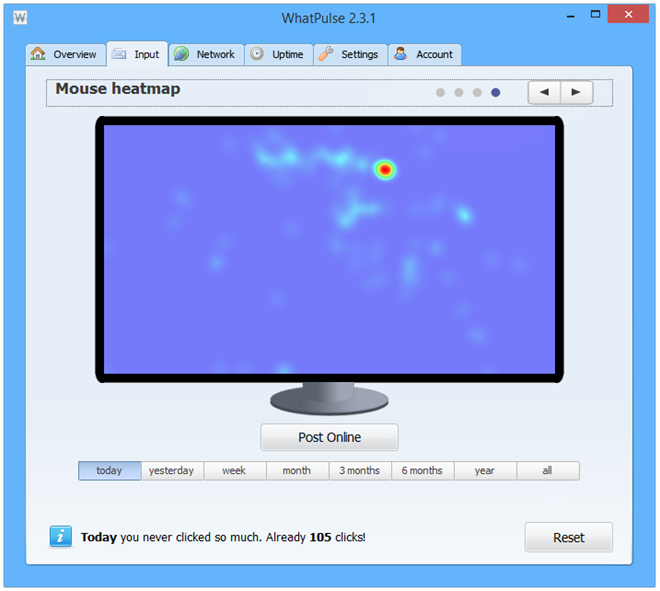
There’s a mouse heat map in this section as well. You can switch to it from the arrow buttons near the top-right corner. It indicates clicked areas of the screen with spots, the color of which depends upon how many times the a certain area was clicked. Red indicates areas that were clicked the most. Like the aforementioned keyboard stats, this information can be viewed under different time periods.
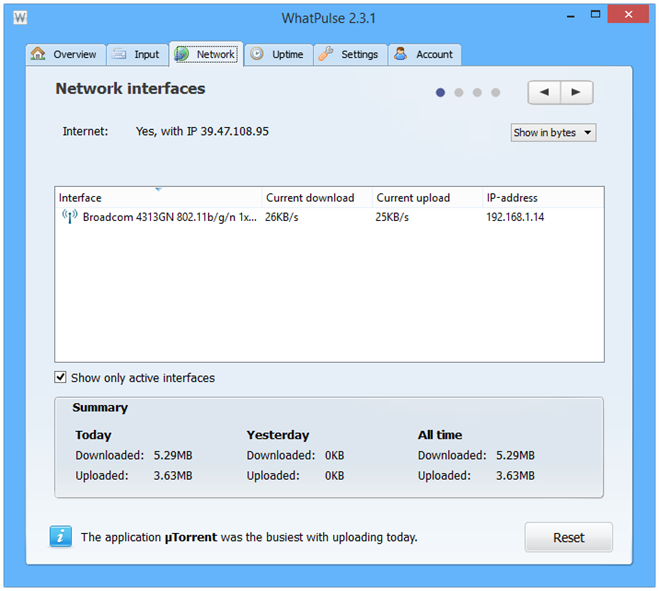
Under the Network tab, you can view your daily Internet usage. The application can monitor bandwidth usage of all the network devices, and even shows you bandwidth usage by country. Once again, you can navigate between available data using the arrow buttons at the top-right.
The application is well-crafted, easy to use, and while it might not be one of those tools you really need, it is definitely worth trying out, especially if you’re into system monitors and stats. It works on Windows XP, Windows Vista, Windows 7 and Windows 8.
