ProcDump – Process Dump Utility For Developers/System Administrators
As a System Administrator or Programmer you require precise logs for the activity and resource consumption for processes so that appropriate measures may be taken to resolve any issue relevant to the processes under observation. ProcDump addresses this requirement and provides the flexibility to gather valuable information in logs regarding the processes which causes CPU Spikes.
Now I will explain how we can utilize this tool. First of all download the executable file from the link mentioned at the end of this post, unzip the downloaded file and then open the command prompt, and go to the unzipped folder and run the procdump command to generate the dump(s) for process(s). Lets spend some time on understanding the syntax of the procdump command.
The simplest format of this command is:
procdump [[<process name or PID> [dump file]]
If you wish to include the CPU usage details as well then add the –c parameter, and the command becomes:
procdump [[[-c CPU usage<process name or PID> [dump file]]]
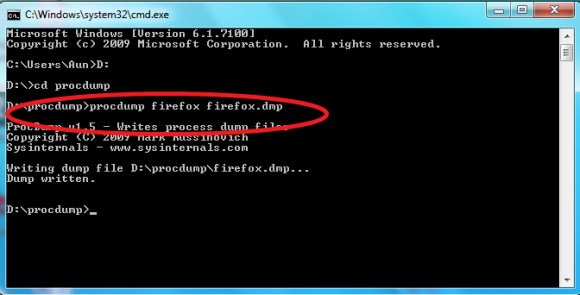
Here is an example, Say I want to generate the dump file for firefox, then I will run the procdump command as follows. This will dump the firefox process’s spike details in a file with the name firefox.dmp
procdump firefox firefox.dmp

This tool has been made available by Microsoft TechNet. It works on Windows XP, Windows Vista, and Windows 7 . Enjoy!
