How to set up Grafana on Windows Server
Grafana is an advanced, web-based data analysis program for Windows, Linux, and other platforms. In this guide, we’ll show you how to install Grafana on your Windows Server system.
Downloading Grafana on Windows Server
To get started with Grafana on your Windows Server, you need first to download the software. To download it, head over to the official download page. Once there, find “Windows,” and select it with the mouse.
Upon selecting “Windows,” find “Windows Installer (64-bit)” and download it to your Windows Server. Alternatively, if you wish to use a standalone Grafana binary, you can download a ZIP file. However, the standalone binaries are not recommended if you are not an expert, and we will not be covering this method of Grafana on Windows Server in this guide.
How to install Grafana on Windows Server
Once you’ve downloaded the Grafana EXE file to your computer, open up Windows Explorer, and select the “Downloads” folder. Once there, find the Grafana MSI file and double-click on it to start up the installation wizard.
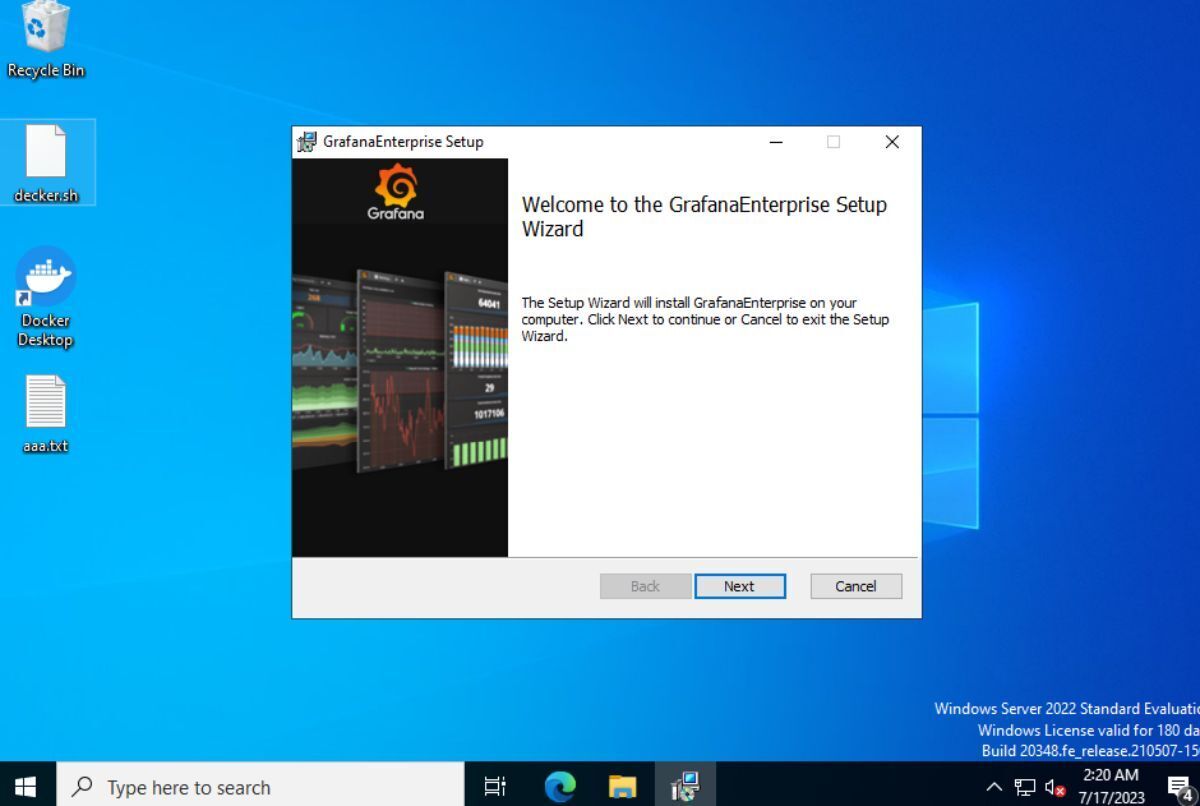
With the Grafana installation wizard open, you’ll see “Welcome to GrafanaEnterprise Setup Wizard.” Read the welcome message, and then select the “Next” button to move to the next page in the installation tool.
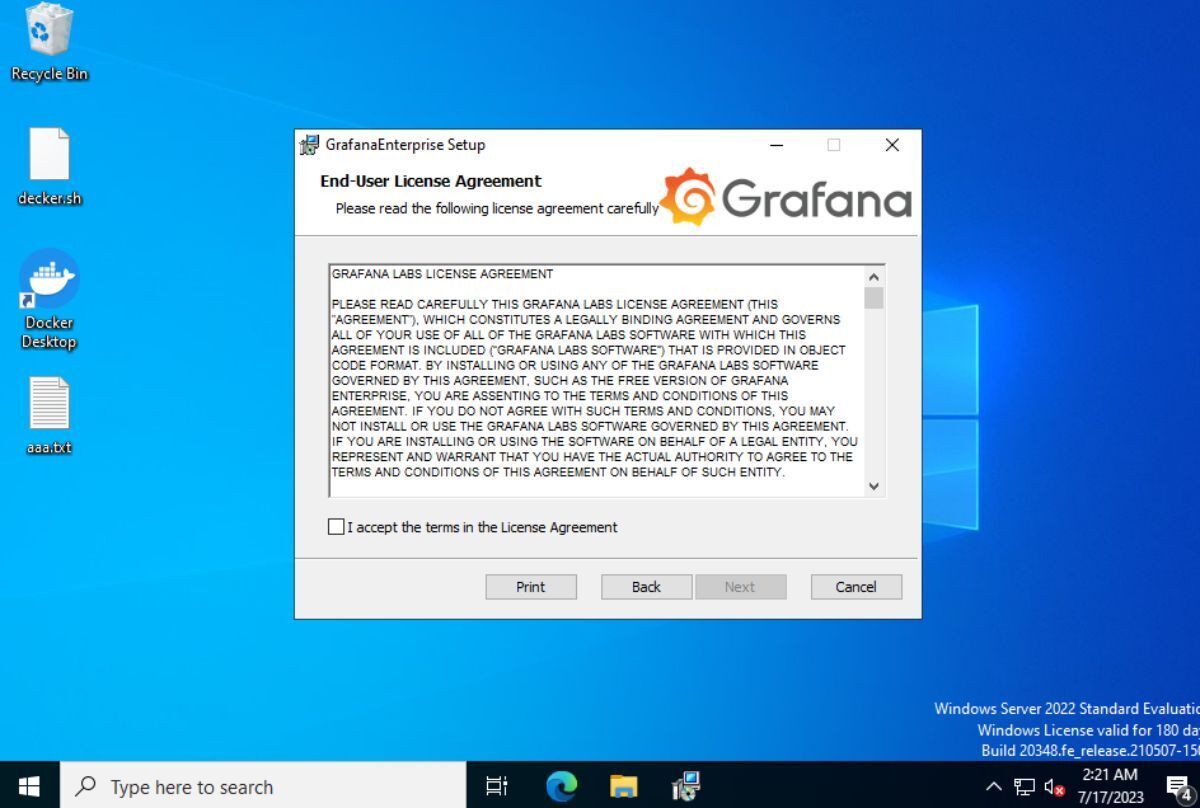
After selecting the “Next” button, you will be presented with the “End-User License Agreement.” This is a long legal agreement. Read it. When you’ve finished reading it, check the “I accept the terms in the License Agreement” box. Click the “Next” button to continue when done.
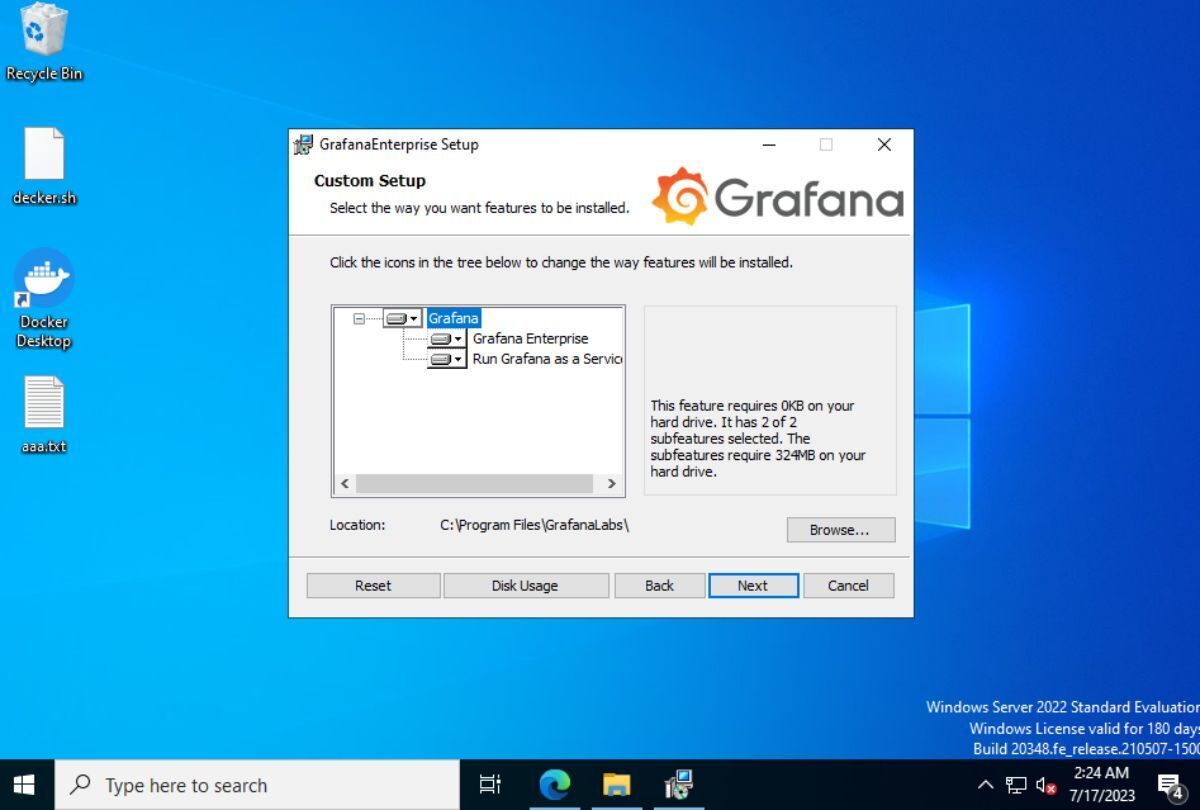
With the EULA accepted, you’ll be presented with the “Custom Setup” page. On this page, select the components of Granfana you wish to install on Windows Server. By default, everything is selected. Customize the installation to suit your needs. Click the “Next” button when done to continue.
On the next page, the installation tool says it is “Ready to install GrafanaEnterprise.” Find the “Install” button, and click on it with the mouse. When you select this button, it’ll start the installation process.
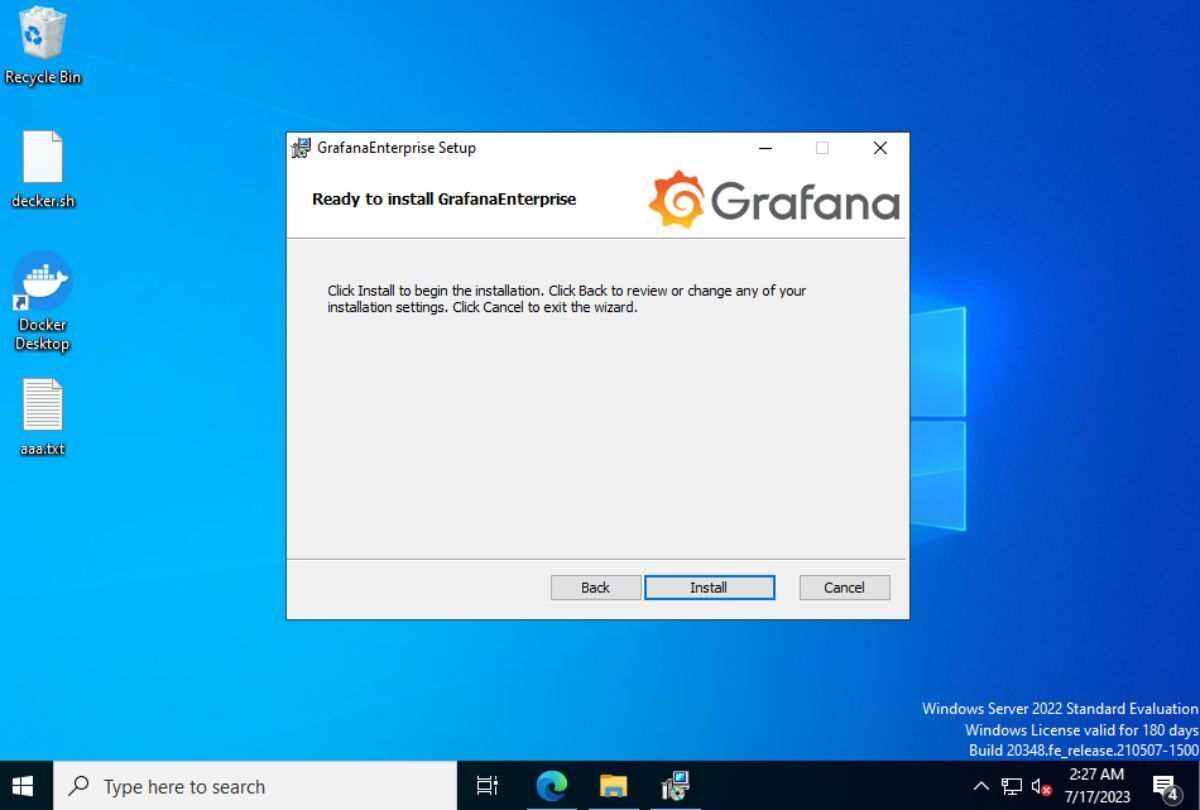
When you select the “Install” button, Grafana will install itself to your computer. This process should be quick. When the installation is finished, find the “Finish” button, and click it to close the installation tool.
Accessing Grafana
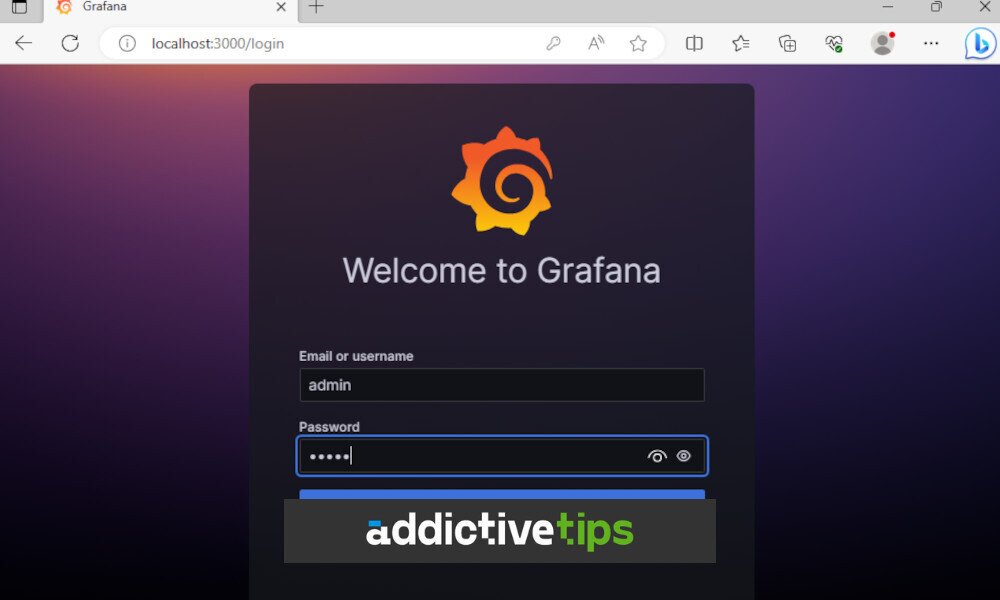
Now that the Grafana application is installed on your Windows Server device, you’ll need to access it. To access Grafana on your Windows Server, start by launching a web browser on the Windows Server desktop. Once it is open, navigate to the following URL in Microsoft Edge, or whichever web browser you prefer to use on the Windows Server Desktop Experience.
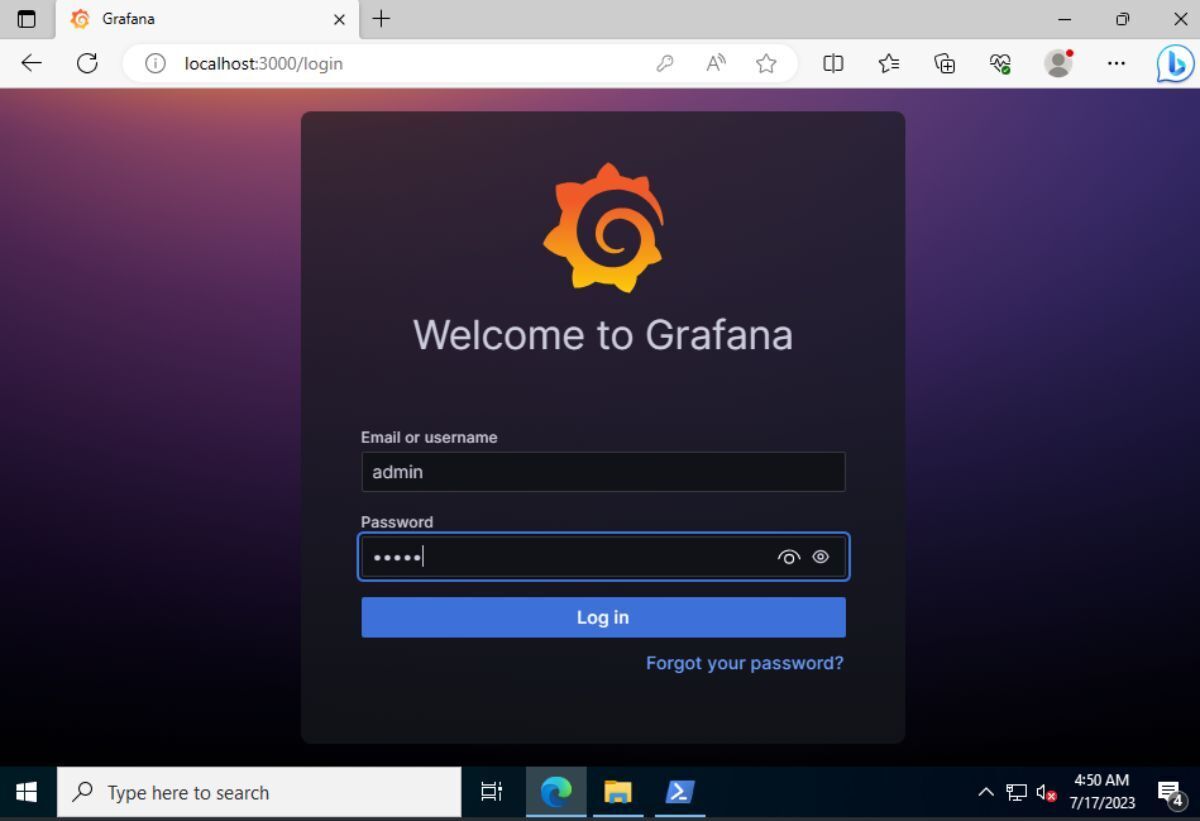
http://localhost:3000/login
Alternatively, if you wish to access Grafana from other computers on your network, you’ll need to use the local IP address of your Windows Server.
http://windows-server-ip-address:3000/login
If you do not know your Windows Server’s local IP address, you can open up a PowerShell window and enter the command below. Note that this command assumes your server’s network device is “Ethernet”. If it isn’t, you’ll need to replace it.
(Get-NetIPAddress -AddressFamily IPv4 -InterfaceAlias 'Ethernet' | Where-Object {$_.PrefixOrigin -eq 'DHCP'}).IPAddress
After accessing the Grafana URL in your browser, you’ll need to log in. By default, Grafana is set so that users log in with admin for a username and admin for the password. Enter this information to log into Grafana.
When you enter the default username and password, Grafana will immediately prompt you to change your password from the default. Enter a memorable, and secure password. If you’re having trouble thinking of a good password, try the BitWarden password generator.
Getting started with Grafana
Grafana is an incredibly complex data visualization app. As a result, it would take a lot of words to cover how to master it in this article. Thankfully, when you log into Grafana for the first time, you’ll be met with the “Basic” area.
In the “Basic” area, locate “TUTORIAL DATA SOURCE AND DASHBOARDS” and click on it using the mouse. This in-depth tutorial, provided by the developers of Grafana, can quickly get you up and running with the app, helping you set up dashboards, data sources, and more.
For more information on getting started with Grafana on your Windows Server, check out the official documentation. This documentation is in-depth and covers just about everything you need to know about it.