Fiddler: Monitor HTTP Traffic For Any Application & Filter Data Tracking
Ever wanted to know which servers the HTTP requests traverse while reaching a specific web server? Fiddler is a comprehensive web debugger for Windows, which tracks and logs all HTTP connections, and data exchanged between your network interface and internet. The application gives insight into files, connections, cookies and other objects that were exchanged during each session. Apart from inspecting the HTTP traffic, it also sets breakpoints and manipulates both incoming and outgoing data to let you view the data that is being downloaded and uploaded. Moreover, the application is capable of tracking traffic from all applications that support proxy connections, processes, and especially web browsers to view send and receive requests. Additionally, it can be used to debug internet traffic from mobile devices including Android, Windows Phone & iPhone.
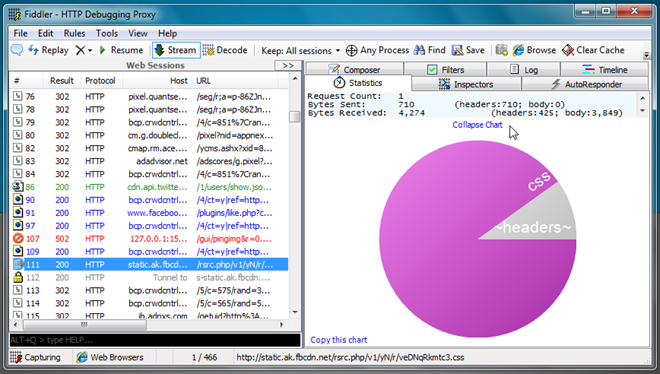
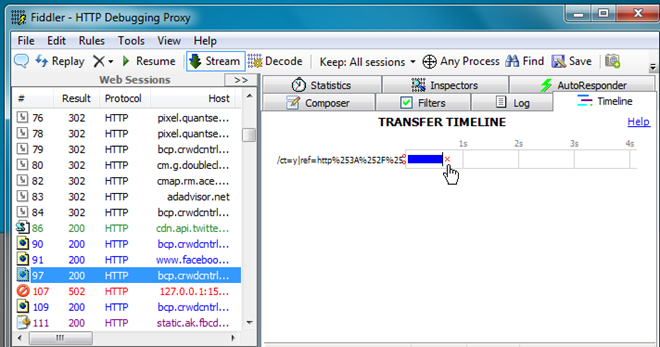
To begin debugging traffic, launch the application and open any supported program to start monitoring. The right side pane helps you view connections, files, images, errors and other objects that are being sent and received, whereas the main window shows the statistics of selected object. By default, it inspects all type of traffic that passes through the network interface, but you can use built-in Filters feature to monitor only required types of objects. It creates a timeline for network traffic, logs each activity, and shows Headers, Web Forms, HexView, Auth, Cookies and Raw data from Inspectors tab.

The Statistics shows request count, total bytes sent and received, DNS Lookup, HTTP/HTTPS handshake and TCP/IP connect time, Along with this information, you will also get to see estimated worldwide performance statistics, which helps you compare your results with others. The AutoResponder allows you to create, view and reorder rules. It requires adding URIs to create a rule. Once created, check Enable automatic responses option to begin auto-responding. For each object, it creates a transfer timeline on a Waterfall diagram, allowing you to view info about each entry.

From toolbar, you can add comments to selected session, remove session from the list, resume paused sessions, and enable/disable Stream and Decode modes. The Stream mode is used to skip all breakpoints and stream only HTTP responses, while the Decode mode decompresses traffic for easy viewing.
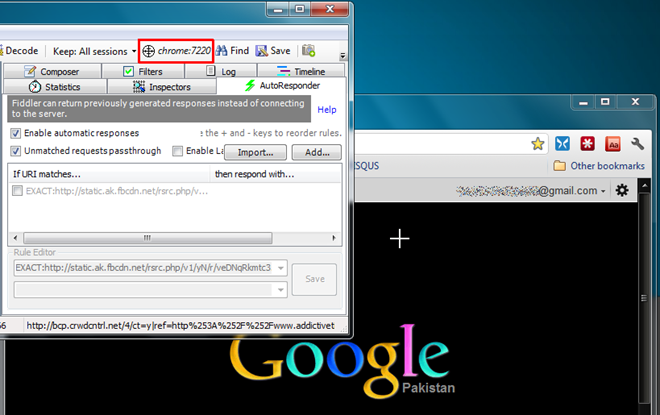
Fiddler saves all sessions in a history, but you can use Keep Session drop-down menu to select the maximum number of sessions to keep. Alongside Keep Sessions, it presents Any Process icon, which when dragged over a window starts showing traffic from that window. For instance, if you want to view traffic from Google Chrome, drag the icon over Chrome window, and it starts showing traffic from only Google Chrome.

Fiddler is an all-in-one HTTP traffic tracking tool that supports all types of applications. If you want to configure Android, Windows Phone, and iOS device to use Fiddler, check out Configuring Clients section here. It works on both client and server editions of Windows.

Is there a way to ONLY see http traffic from a specific Chrome Tab ?