Monitor Network/Internet Bandwidth Usage Online With BitMeter OS
BitMeter OS is an opensource bandwidth monitoring application designed to keep check on internet/network usage and offers a variety of different information which assists user to infer the overall network bandwidth consumption. The program runs silently in the background, noting down each instance of all the applications which are using internet connection, for measuring out the total usage.
It runs on localhost, so a web-browser is needed to use the application. Since it is a web-based application, through port forwarding, you can remotely analyze the bandwidth usage. You’d just need to allow the incoming connections for viewing and analyzing the network usage remotely.
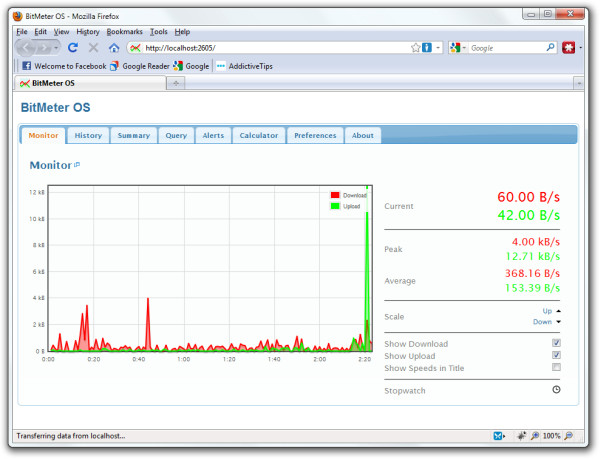
The interface is simple in terms of usage. It charts out bandwidth consumption in real-time, letting you view the consumption ratio visually. Alongside chart, you can also view the generic statistics, including peak usage, average usage, etc., with an option of customizing the charting scale. From the bottom, you can bring up stopwatch to measure the downloading/uploading peak and average time.

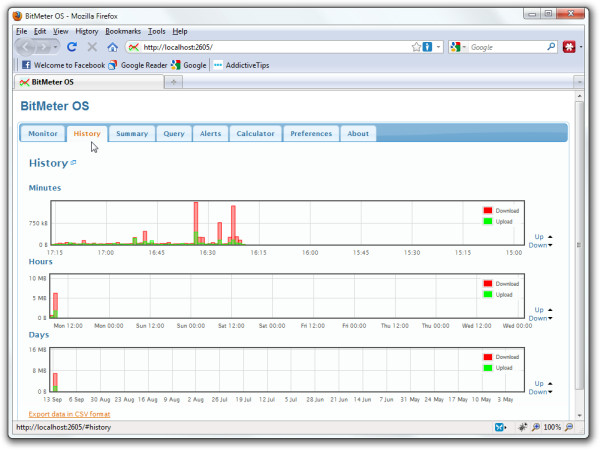
From History, you can view the history of internet/network usage. It classifies history into three charts namely Minutes, Hours, and Days. Under each category, you can view the bandwidth usage over a respective scale. The chart scaling options are also provided, you can change them according to the network usage.

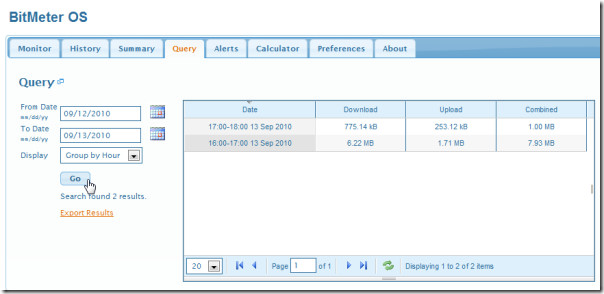
It also supports pulling out bandwidth usage-related information with the help of query. You can specify the span of time for which you want to generate report. It will show you the download and upload information separately along with the total bandwidth usage.

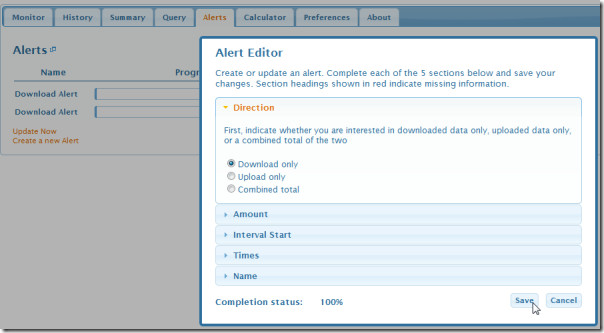
Alerts can also be assigned with a bandwidth usage limit, once the limit is reached, it will notify you about it immediately. The Alert Editor requires bandwidth usage, limit, start interval, etc to be entered in order to create an alert. Once you’ve created an alert, it will start noting down the bandwidth usage.

A calculator is included to find out how long it will take to transfer a given amount of data. The Preferences window refers to changing download/upload data color on graphs, enable/disable data filters, and changing data units.
All-in-all, it is a comprehensive application which lets you check everything you need to know about network/internet bandwidth usage. Significant features are; Query and Alert that helps user in filtering out the internet usage information and applying limit on network usage respectively. The application is in beta and works great. If you like it, don’t forget to give feedback to the developer.
For more, you can check out iTraffic Monitor and Networx.

Does it analyze the data on the entire network?
VERY GUD