Process Explorer Updated: Check App GPU & Disk Usage, Restart Services, Create Minidump & More
Developed by Windows Sysinternals, Process Explorer is probably the most feature-rich Windows process explorer that gives in-depth information on each process running in the background. It also allows you to investigate that which application is accessing which files and system/user locations. Back in 2009, we covered numerous aspects of Process Explorer. Since then, it has been updated with quite a lot of new options and features, including svchost’s service host category display, option to restart service, mapping of service names to threads, ability to generate full and minidump process crash dump file, comprehensive network and disk monitoring, detailed memory statistics, separate column to check aggregate CPU usage, summary tab in System Information dialog to view CPU, Memory, I/O and GPU usage graphs and more. Apart from significant feature improvements, the application has also been deeply debugged to give most accurate system information including CPU, Memory and Network usage, and overall system performance.
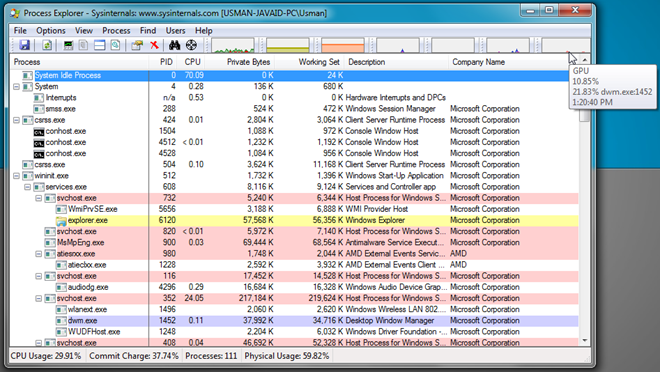
Some interface-related changes have also been made. For example, you can now check GPU usage graph from toolbar. It now comes with visually cleaner performance graphs, and has a smaller memory footprint.
The new interface offers a wide view of all the running applications, system utilities and their threads. On toolbar, you will find variety of tools including System information, save current process list, refresh list, kill process or close selected handle, and find selected window process. Alongside these tools, CPU, Memory, Network, I/O, Disk and GPU usage graphs are lined up, which allow you to visually analyze overall system performance.
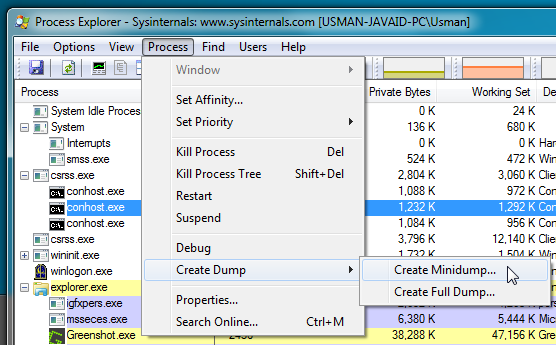
The Process menu comes with 2 extra options, namely Debug and Create Dump. You can associate any third-party debugger with Process Explorer to debug the processes. The Create Dump menu allows you to create minidumps and full dump with a single click.
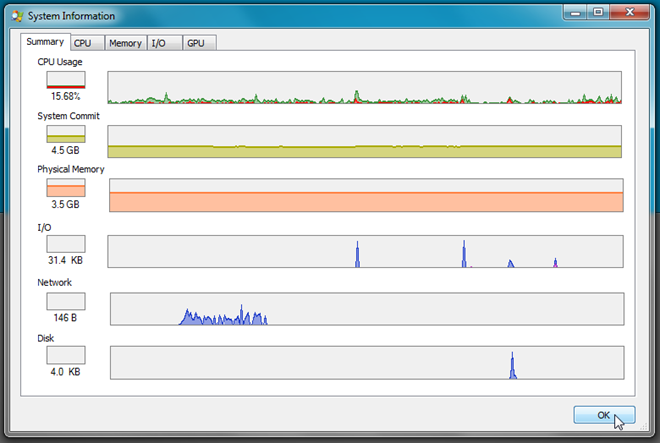
As mentioned earlier, it now comes with a Summary page, which is accessible from System Information dialog. It displays CPU, Sys Commit, Physical Memory, I/O, Network and Disk usage on graphs. Hovering mouse pointer over the graph shows current details about usage. For instance, it displays current processes which are using CPU resources on CPU graph.
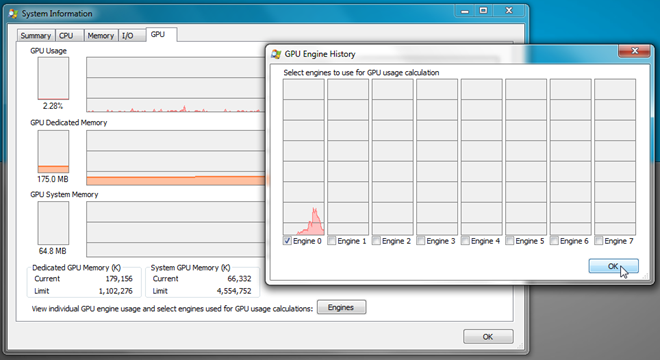
Process Explorer allows you to pick the GPU engine that you want to use for monitoring GPU usage. In GPU tab, you can view memory resources that are being used by GPU and total System GPU memory. Clicking Engines will show another dialog, where you can select the GPU engine to calculate GPU usage.
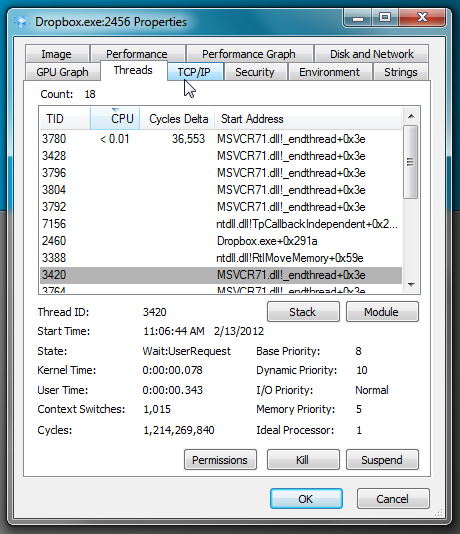
You can bring up Process properties from right click context menu as well as Process menu. It shows everything that you need to know about the selected process, including Disk and Network usage, CPU and GPU usage graph, TCP/IP connections, Security sessions access, process environment, running threads and more.
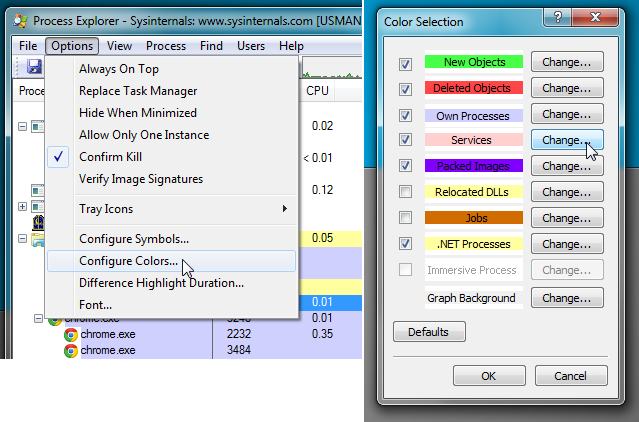
The application enables you to configure the main window. It lets you choose the column colors, change symbols, and set custom highlight duration.
The above mentioned changes have surely transformed Process Explorer into a powerful system monitoring tool, enabling users to keep check on suspicious applications’ threads, and CPU, Memory and GPU usage. You can check release notes and brief changelog on product page. It works on all versions of Windows. including Windows 8 Developer Build.

Another really good alternative is Process Hacker. I tend to switch between the two a lot since they’re both excellent.