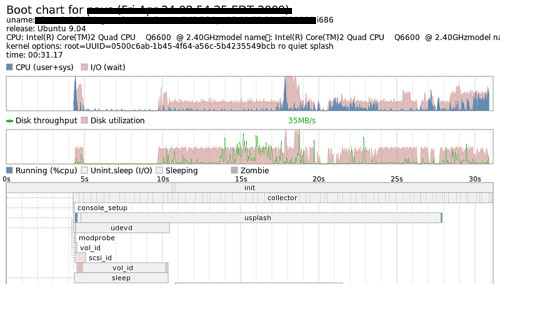
Measure Your Ubuntu System’s Boot Performance With Boot Chart
Ubuntu has the fastest boot time as compared to the other Linux based systems. Frankly speaking, the boot speed of Linux based systems depends upon different factors particularly the applications which we have configured to start on the system start up. Bootchart is a tool for the analysis of the performance of the GNU/Linux boot process and boot performance.
Boot Chart automatically makes a chart of your system’s boot performance, its very easy to install it in Ubuntu, simply run the following command in the terminal.
sudo apt-get install bootchart
It will be installed instantly, once the installation is complete, reboot your system and thats all, during the reboot process it will keenly analyze your system and will create the boot chart of your system start up process. You can find the latest boot chart in /var/log/bootchart.

Once you look at the boot chart, you will get an idea of what applications are enabled on system start up and thus in case you feel that your system is booting slowly, you can easily identify the culprit applications from the boot chart so that you may disable them which will enhance the performance of your system. Enjoy!

Sorry if this is a stupid question (no one else seems to have asked this), but how do you analyse the boot chart? What is my goal? Should I be trying to optimise the system to fill all the process bars with pink (I/O, according to the legend) or to fill the top graph with blue (CPU usage)?
Thanks.