How To Monitor Your System Performance In Ubuntu Linux
You can obviously achieve better system performance if you are monitoring your system properly. Every operating system has the tools and techniques to monitor the system performance , so does Ubuntu Linux. You can monitor your Ubuntu system in one of the following ways.
Method 1 : Use System Monitor
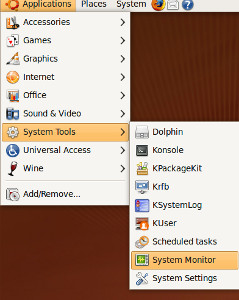
System Monitor is a default installed utility to monitor the system. It can be loaded from Applications > System Tools > System Monitor.
Update: What we showed below is the System Monitor for KDE. As the commenter(Vadium) rightly points out the System Monitor of default Genome environment can be accessed by going to System > Administration.

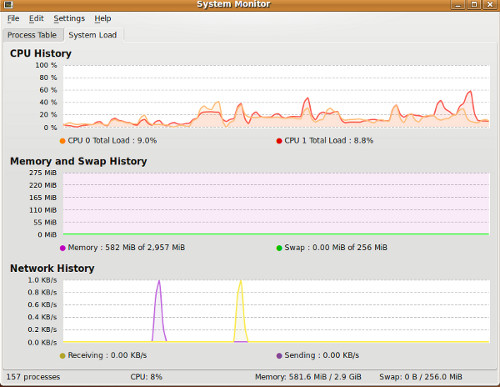
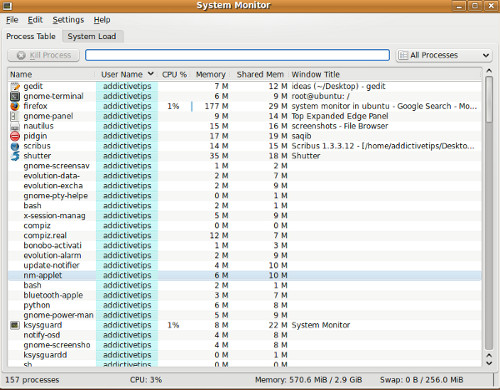
It has a very eye-candy graphical interface with two main tabs, Process Table and System Load.
Process Table shows the CPU, memory, and network performance in the form of graphs. Have a look at the following screen shot.

Now, lets explore the System Load tab, it will show you all running programs along with their memory usage. From here you can get an idea which program is consuming more resources of your system.

Method 2: Use Saidar
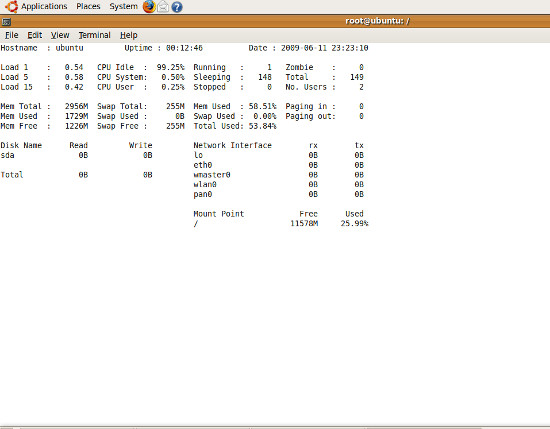
You can use the saidar tool to monitor your system. It is a tool which shows system performance in terminal. So to use saidar, you must be familiar with terminal. To install it, simply run following command in terminal.
sudo apt-get install saidar
It will install in no time. Once installation is complete, open your terminal and run following command.
saidar
You will get information about your CPU and memory in terminal.

I hope that this article proves useful in helping you to monitor your system performance on Ubuntu. If you are on Windows, I believe you should have a look at this article. Enjoy!

How to hide system monitor application on ubuntu 12.04
Personally I prefer SAR. I think its something like the saidar you mention since it gives raw outputs that make it more reliable while debugging. It allows your to monitor all required parameters in real time like free mem, disk usage, uptime, etc
Came across this tool called SeaLion when I googled which works like SAR with some conveniences. Its easy to setup and use and shows all outputs on a timeline. It can be used to check multiple servers and compare them(as would be required in an organization where server performances are interconnected).
It could be useful for users in future
Personally I prefer nmon for monitoring from the console.
apt-get install nmon
Nice article.
Nice article.
Nice article.For more jobs visit http://www.staffingpower.com
^ the apt link in there did not work 🙁
saidar tool is included in repositories of almost all Linux flavors, If you are unable to find this on Ubuntu via apt, you can try after updating your Ubuntu repositories, It should work then 🙂
You were actually using KDE’s system monitor in there. Gnomes is in System – Administration 😉 (although as you see, the design of the KDE4 one closely resembles).
I’d recommend htop too. It’s terminal-based, but easy to use, very light on resources, and colorful.