

What Is Network Latency and How to Measure It
Have you ever noticed how networks sometimes seem to slow down to a crawl? You most certainly have. When that happens, it is often a sign of high latency. Latency, one of the biggest plagues of networks, is unavoidable but it must be kept within reasonable values. Today, we’ll be having an in-depth look at what is network latency and how to measure it. We’ll also make sure to include a few reviews of the best tools you can use for that purpose.

Our exploration will begin by having a good look at latency, what it is, why it exists, and why it is such an important metric to monitor closely. We will next discuss what can concretely be done to improve latency and how it can be measured. And armed with all this knowledge about latency, we’ll finally explore the best tools you can use to measure latency in your own environment.
Network Latency In A Nutshell
Network latency is easy to describe. It is a measure of the time it takes for a data packet to get from its source to its destination. Understanding what it is and why it is a relevant metric is a different story. In an ideal world, there wouldn’t be any network latency. But in reality, there will always be some. No matter how hard we try, there is no way that data can travel through a network instantly. But although latency is unavoidable, one must always ensure that it doesn’t get so high that it starts affecting the normal operation of the network.
There are several factors that contribute to latency. First, there is propagation time—the unavoidable factor. Although networks are fast and bits travel at the speed of light (not exactly, but they travel really fast), it still takes some time for data to reach its destination. The longer the path, the more time it will take, just like it takes longer to travel 100 miles than to travel 50. For that reason, the latency between two computers located thousands of miles from each other will always be higher than that between two computers in the same room. Another factor contributing to latency is referred to as the transmission delay. This is a delay that can be introduced by the medium itself. It varies as a function of the size of the data packets. Larger packets will have higher latency as they take more time to serialize and deliver.
Router and various other processing delays are also contributing factors to network latency. Even on barely used circuits where queuing is absent, each router needs to manipulate data. For example, the TTL header field of each packet must be decremented. Also, most networking devices will wait until a packet is completely received before sending it. Again, bigger packets will entail longer delays. These are just a few examples but there are several other ways that latency can be introduced in network transmission. We can think of queuing delays that happen when data cannot be sent immediately or storage delay when it has to be cached to disk or memory and then retrieved. We could write a lengthy post on just that subject but you probably get the picture.
The Importance Of Latency
It is relatively easy to understand that, when latency gets too high, it can affect the usability of networks and cause perceived performance degradation. This is what makes it such an important metric to watch. High—or higher than usual—latency is often a sign that something is wrong with the network or on the network. More often than any other cause, high latency will be the consequence of network congestion. Networks are like highways and when there’s too much traffic, things slow down and you get higher-than-normal latency.
But measured latency is not necessarily a sign of congestion or another network issue. Since latency is typically calculated by measuring the round-trip time, a common source of latency could be the distant device itself. If the remote device is very busy doing whatever it is that it has to do—and that might have nothing to do with the network, it might not respond right away to the requests it receives from the latency measurement tool. When that happens, it will be perceived as network latency but it has, in fact, nothing to do with the network and latency measurement won’t give you a clue about this.
Similarly, users could experience latency that has nothing to do with the network. Application latency is possibly just as common as network latency. When servers get overloaded, the start responding more slowly. Just like networks do when they get congested. Unfortunately, as important as it may be, server and application latency is not on today’s agenda.
Improving Latency
Imagine that your network is suffering from latency and the measurement tools you’ve put in place have detected it and alerted you. Now you need to find ways to reduce network latency. There are several ways you can go about doing this but how to fix high latency depends on what is causing it. With network over-utilization being the most common cause of network latency, let’s see what can be done about that.
Network circuits are not unlimited and when they get over-utilized, congestion occurs and users experience high latency. It works exactly like highway traffic. This is particularly true with WAN circuits which often have more limited bandwidth that your typical LAN. When this happens, the best way you can improve latency is by reducing network usage. This, in itself, is a whole domain of network administration that deserves its own post. And in fact, we already did a post on improving network performance, and there are many tools you can use to assist with this task.
Measuring Latency
Measuring network latency can be more complicated than it looks. This is particularly true when measuring the latency between very distant points. There are a few reasons for that but it’s mostly due to the fact that even huge latency is still relatively short, in the order of a few thousandths of a second. You can’t really call your friend at the other end and tell him “OK, I’m sending you a packet, tell me when it arrives” and measure the delay. Chances are the packet will arrive before you’re even done talking. So, forget manually about timing it.
Typically, latency is measured by sending a packet that is returned to the sender and measuring the time it takes for the response to come back. It is this round-trip time is considered to be the latency. There are a few disadvantages to this evaluation method. For instance, if the return path is different, the latency figure won’t tell you which of the forward or return paths is experiencing latency.
Another possible issue is that the types of packets used for measuring latency—typically ICMP requests and replies—are not always treated by the network devices with the same priority as some other network traffic. In fact, some routing devices will simply drop these packets and most firewalls will do that too.
The Top Latency Measurement Tools
There is not one universal way of measuring network latency. Consequently, there are various types of tools that can be used for that purpose. Latency measurement (often called round-trip delay) is a metric that all the tools reviewed below incorporate. Some will just measure latency while others will help you pinpoint it. Others yet measure bandwidth utilization rather than latency. They can still help since we know that over-utilization is the main cause of high latency.
1. SolarWinds Network Performance Monitor (Free Trial)
SolarWinds is one of the best-known makers of network administration tools. The company has been around for about 20 years and it has a solid reputation for making some of the best network and system administration tools as well as several simpler free tools.
The SolarWinds Network Performance Monitor is the company’s flagship product. Arguably one of the best SNMP bandwidth monitoring tools, it is packed with so many features that we could write about it for ever. One of the tool’s best advantages is most likely its simplicity which, fortunately, does not come at the price of flexibility. Dashboards, views, charts, and reports can be fully customized to your preferences or needs. The tool can be set up in minutes and it can scale from the smallest of networks to huge ones with thousands of devices.

The SolarWinds Network Performance Monitor won’t directly measure network latency, though. But by giving you detailed information on the bandwidth usage of every part of your network, it will let you quickly identify trouble spots where congestion might be the cause of high latency.
The SolarWinds Network Performance Monitor uses the Simple Network Management Protocol (SNMP) to periodically poll your devices and read their interface counters, computing bandwidth utilization and displaying it as graphs. Configuring the tool only requires that you specify a device’s IP address and community string. Advanced features let you build network maps and display the critical path between two devices, a great feature when troubleshooting latency.
Prices for the SolarWinds Network Performance Monitor vary according to the number of monitored devices and starts at $2 955. If you would like to try the tool before purchasing it, a full-featured 30-day trial is available.
2. SolarWinds NetFlow Traffic Analyzer (Free Trial)
Another excellent product from SolarWinds, the NetFlow Traffic Analyzer can give administrators a more detailed view of network traffic. It will not only show you utilization and potential latency but it will also show you where it’s taking place and what is causing it. The tool provides detailed information on what the observed traffic is. For instance, the tool will let you find out what type of traffic or what user is consuming the most bandwidth. The tool’s dashboard has plenty of useful views available such as top applications, top protocols or top talkers.

As you’d guess from its name, the SolarWinds Network Performance Monitor uses Cisco’s NetFlow protocol to gather detailed usage information from network devices. Originally created by Cisco, the NetFlow protocol allows devices to send detailed information about each network “conversation”, or flow, to a NetFlow collector and analyzer such as this tool. This information contains several elements that can be used to analyze the traffic. Many manufacturers other than Cisco also include NetFlow functionality or an equivalent in their equipment, sometimes calling it a different name. Recently, the NetFlow protocol has been standardized as IPFIX, or IP Flow Information Exchange, by the IETF. The SolarWinds NetFlow Traffic Analyzer will work with all variants of the protocol, making it an excellent choice.
The SolarWinds NetFlow Traffic Analyzer is an additional module that installs on top of the Network Performance Monitor reviewed above. Pricing starts at $1 915 and varies according to the number of hosts. And just like with most SolarWinds paid products, a 30-day free trial is available.
3. PRTG Network Monitor
The PRTG Network Monitor from Paessler AG is another bandwidth monitoring tool. It is known to be one of the easiest and fastest to set up. Paessler claims that you could be up and running within minutes and truly, setting up the product doesn’t take much time albeit quite a bit more than what is claimed. This is, in part, due to the product’s auto-discovery feature which means that it will scan your network and automatically add the components it finds.
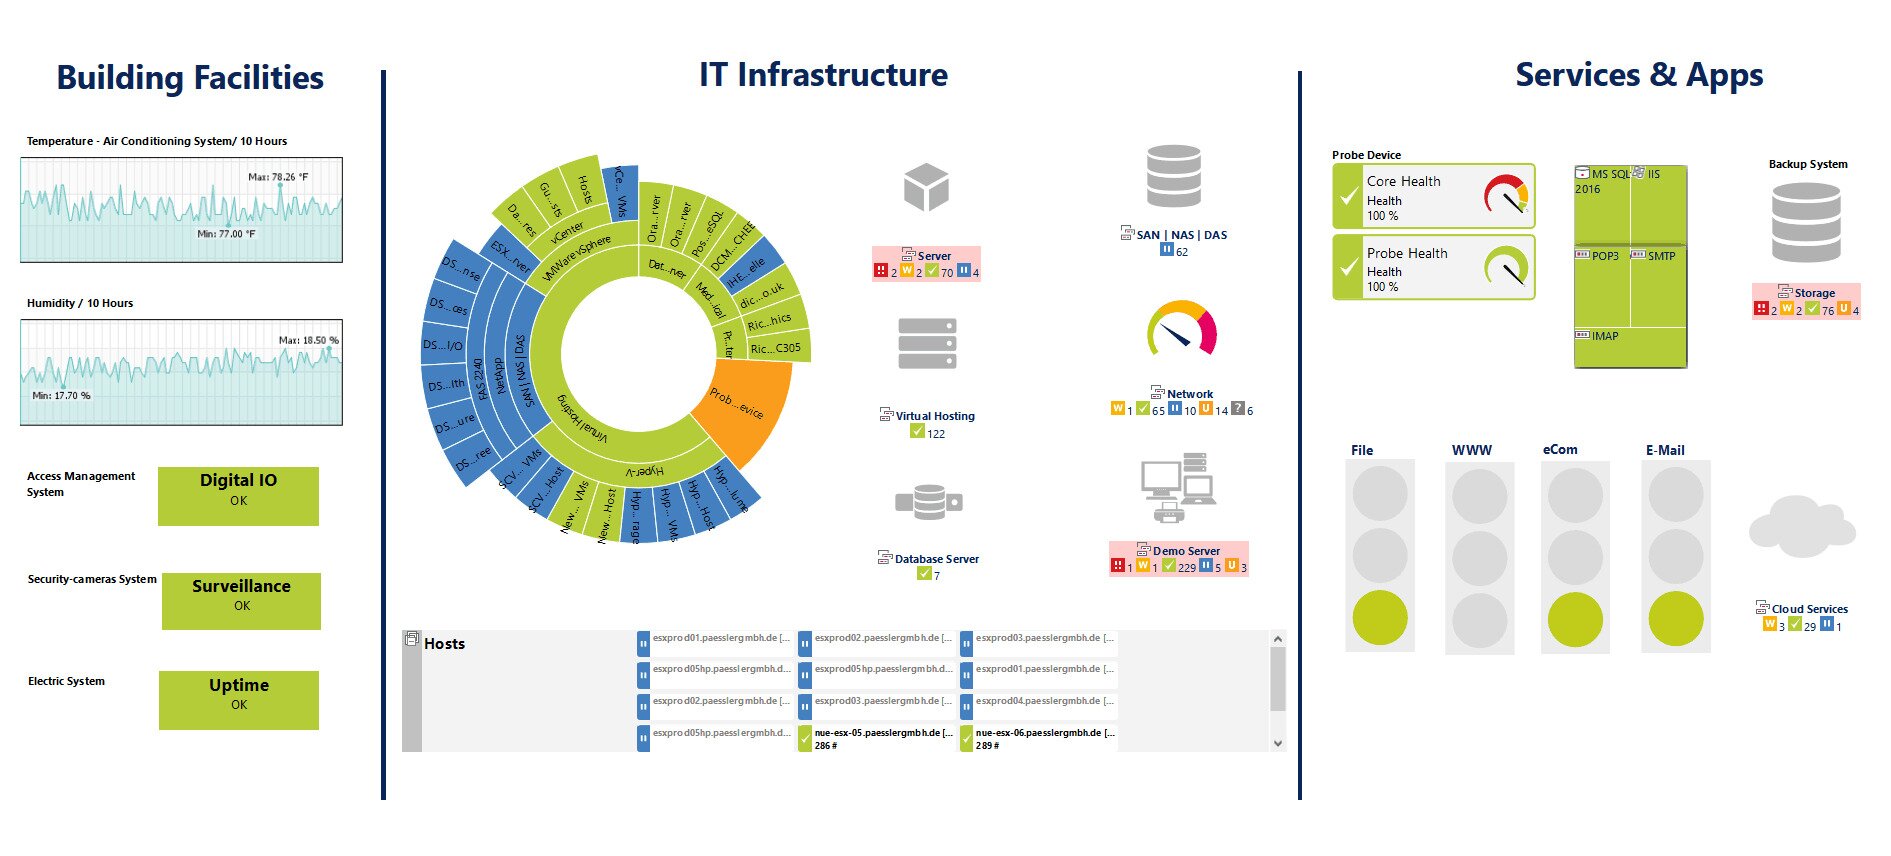
The PRTG Network Monitor comes with several user interfaces, allowing you to pick the one that best suits your needs. There’s a native Windows console application, there’s also an Ajax-based web interface, and there are mobile apps for Android and iOS. And it makes great use of each platform’s capabilities. For instance, the mobile apps will allow you to access any device’s details by simply scanning a QR code label affixed to it. Of course, the Windows console will let you print those labels.
The PRTG Network Monitor uses a combination of technologies for its monitoring. It will use SNMP monitoring but also WMI for Windows devices and NetFlow and Sflow, two similar but competing flow analysis technologies. And the tool has several sensors specifically designed to measure latency. There’s a QoS sensor that will measure the round trip delay, a Cisco IP SLA sensor and a Ping sensor.
4. ManageEngine NetFlow Analyzer
The ManageEngine NetFlow Analyzer is another NetFlow-based monitoring tool that features some advanced latency monitoring features. The tool provides a detailed view of network utilization and traffic patterns. Its web-based user interface will let you view traffic by application, by conversation, by protocol, and more. The tool’s comprehensive dashboard is one of its best features. It offers some of the best versatility and will let you include any data you want. And for on-the-go administrators, there are mobile apps available.
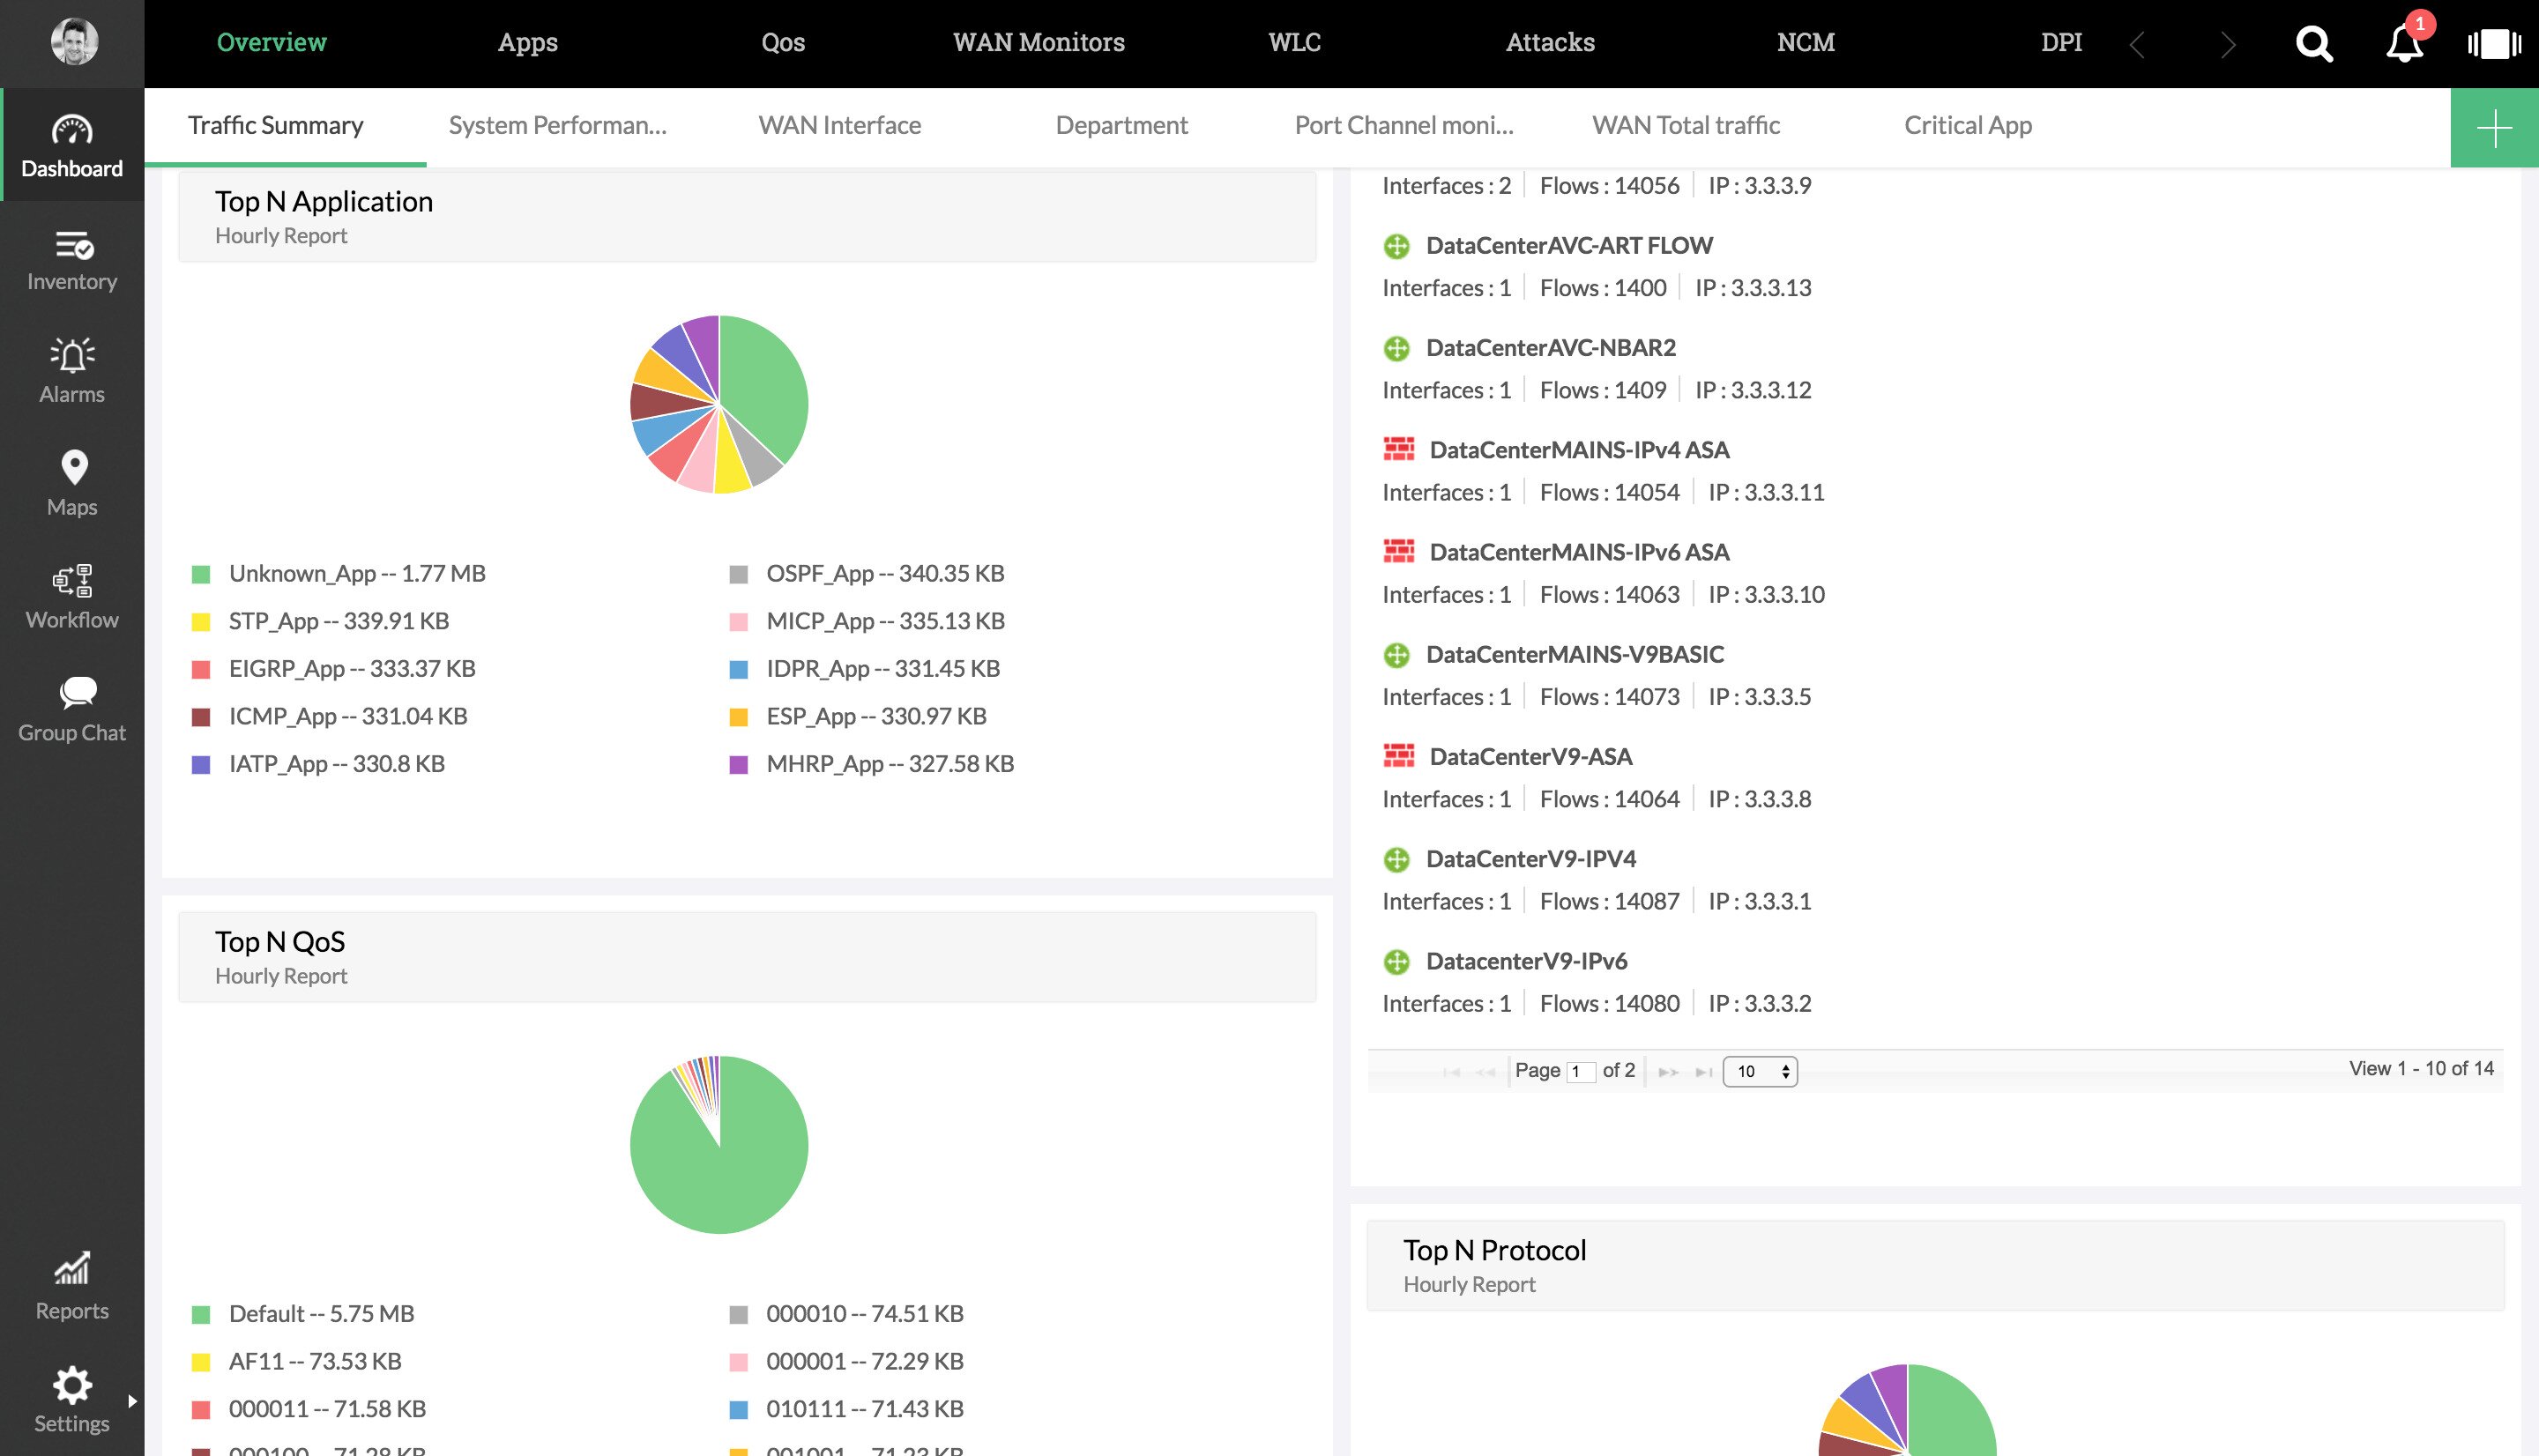
The ManageEngine NetFlow Analyzer supports several flow technologies including NetFlow, IPFIX, J-flow, NetStream and a few others. As a bonus, the too has excellent integration with Cisco devices, with support for adjusting traffic shaping and/or QoS policies right from the tool. And for latency measurement, this tool features a WAN Round Trip Time (RTT) monitor which allows you to monitor WAN availability, latency, and quality of service.
5. PingPlotter
Despite a somewhat misleading name, PingPlotter is actually a graphical Traceroute software that can help solve network problems. This diagnostic tool graphs latency and packet loss between your computer and a target. It allows you to visualize the information, thereby accelerating your troubleshooting process, and can help build a case should you need to convince anyone a problem exists on their end.
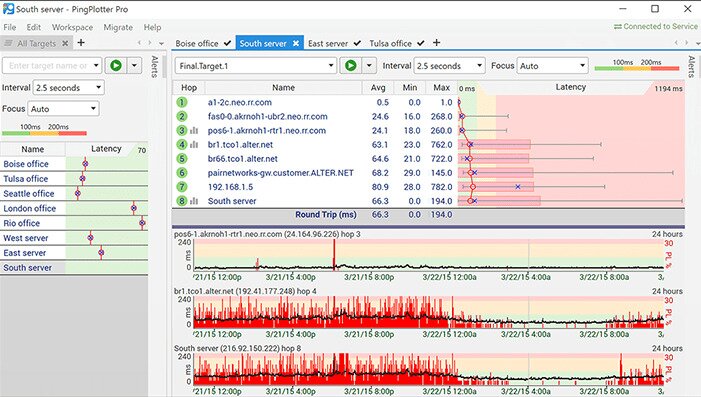
PingPlotter graphs network performance at every hop between the computer where you run it and a target website, server, or device. The tool will test the path to any network-reachable device and it will show where latency happens, saving you a lot of diagnostic time.
While having performance statistics is useful, they only tell you that the network failed—or didn’t fail—during the test and where the failure is. PingPlotter has a useful timeline feature that provides a deeper level of understanding by showing exactly when issues occur. This allows you to differentiate between a consistent failure throughout the test and a short period of severe failure. It can also help correlate the failure with other simultaneous events.
6. MultiPing
MultiPing is another product with a misleading name. Although it primarily uses Ping to accomplish its feat, this is really a monitoring system, somewhat like a smaller SolarWinds Network Performance Monitor. Of course, using Ping rather than SNMP means that the information you’ll get is very different. You can’t expect to see bandwidth utilization with this tool but the one thing you will see is latency. And just like bandwidth monitors will plot graphs of bandwidth over time, this one will plot graphs of latency over time.
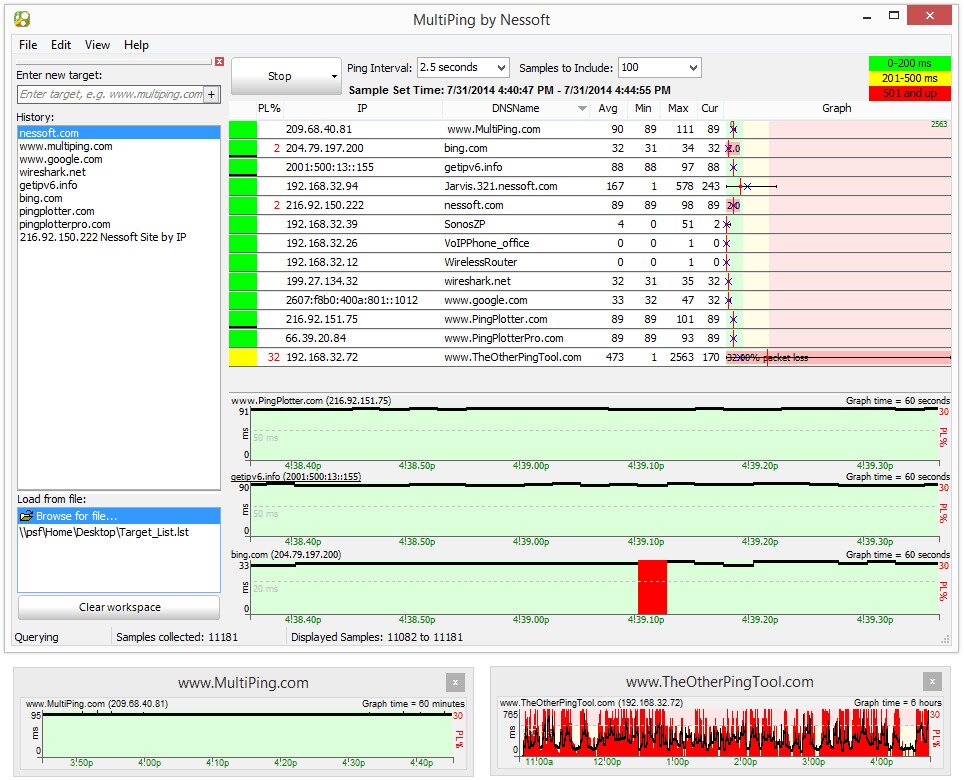
MultiPing will show you packet loss in percentage as well as minimum, average and maximum latency. It has auto-discovery making setting it up is a super easy task. The product’s user interface can be configured to your liking by placing its different components as you see fit. The system also features alerting that can notify you when parameters get out of range. In addition to notifications, programs can be launched on alerts.
7. Ping
You don’t have to download or install anything to test latency, though. Ping is a command that is built right into most modern operating systems. In a nutshell, Ping sends a series of ICMP echo requests to the target IP address and waits for it to respond with corresponding ICMP echo replies. The delay between the request and the reply is called the round-trip delay which is also referred to as latency. And when it fails to receive a response to one of its requests, the utility assumes that either the request or the response got lost in transit and compiles the packet loss information which is displayed once the command finishes executing.
8. Traceroute (Or Tracert)
Similarly, Traceroute—or Tracert if you’re living in a Windows world—can also be used for latency testing purposes. This is another command that is built into most operating systems. It uses the same type of ICMP requests and replies as Ping but it does it in a way that allows it to individually test the response time—or latency—of each network segment along the path. This is even better than Ping as it can give you a pretty good idea of where most of the latency is happening. So this tool can not only measure but also locate latency.
In Conclusion
We’ve seen how latency can wreak havoc with your network’s performance and how important it is to keep it under control. We’ve also looked at how to improve latency and how to measure it. But most importantly, we’ve provided you with reviews of a few of the very best tools you can use to measure latency. All the tools we’ve introduced are excellent and any of them will help you measure latency. They are, however, very different from one another and you should have a closer look at each tool’s detailed feature set before picking one as most of the tools presented will actually do much more than just measure latency.