

How to Use Nmap For Traceroute to Discover Network Paths
Traceroute—or tracert if you’re living in the Windows world—is, together with ping, one of the most-used network troubleshooting tools. As its name implies, traceroute will trace the route from one computer or network-connected device to another. It’s a very useful tool that will not only test the connectivity to a host but also reveal a lot about the path to get there and some issues that may be plaguing it. Although traceroute is a great tool, it’s also a rather limited tool and does nothing but tracing routes. On the other hand, Nmap, another well-know utility—albeit not as much—which is coming from the Linux world provides a way to trace the route to a host but it also offers a lot of extra functionality. In fact, Nmap’s primary uses are discovering networks and scanning ports. Today, we’re having a look at using Nmap for traceroute.
Before we get to the actual explanation of how to use Nmap for traceroute, we’ll begin by first introducing the traceroute utility. Knowing what it is but, more importantly, how it works will help you better understand how Nmap performs the same kind of task. Next, we’ll briefly introduce the Nmap utility, discussing what it is, where it’s coming from and what it can be used for. We’ll follow that by discussing how to use Nmap for traceroute and explain how Nmap actually performs the trace. You’ll see that it is radically different from traceroute’s approach. And finally, we’ll have a brief look at some other tools you can use to trace the route between two devices. As you’ll see, there are plenty of options available.
About Traceroute
The definition of traceroute from Wikipedia is very clear: “Traceroute is a computer network diagnostic tool for displaying the route (path) and measuring transit delays of packets across an Internet Protocol (IP) network”. As good as that description is, it kind of fails to give much detail about what it is concretely and how it works. Let’s explain. Traceroute will tell you the IP address of every router located between your computer and the remote computer. But that’s not all, traceroute will also report on the network delay between each of these routers.
Traceroute is a very old tool. The first version was released back in 1987. This is over 30 years ago; an eternity in computer years. It is also a very common tool. First introduced on the Unix operating system, it is now present on every Unix-like OS including Linux and Mac OS. It even eventually got ported to the Windows platform where it was renamed to tracert because of the original 8-character limit on filenames in Windows.
Traceroute is a tool that every network administrator should understand and use. Unfortunately, many of its users don’t completely understand how it works and can, therefore, run into some of the utility’s pitfalls. For example, the path could be asymmetrical with traffic in taking a different route than traffic out and the tool wouldn’t see it.
Traceroute’s Operation
First, a few prerequisites. The Internet—or any IP network, for that matter—is made of interconnected routers. Routers talk to each other, exchanging information about what networks they know how to reach. They use this information to build routing tables. Whenever a data packet reaches a router, it looks up the destination in its routing table and proceeds to send it to the next router on the path. The router only knows about the next router and has no idea of the complete path. It doesn’t have to.
In order to limit propagation delays due to excessive routing hops, the header of every data packet contains a field of data called the TTL or Time To Live. This is a true misnomer as the value of the TTL has nothing to do with time but everything to do with distance instead. When a packet leaves its origin, the TTL is set to 32. From then on, every router that handles it along the path to the destination decrements the TTL by one before routing the packet. When the TTL value reaches zero, a router will not route the packet and will instead return an ICMP “Time Exceeded” message back to the packet’s origin.
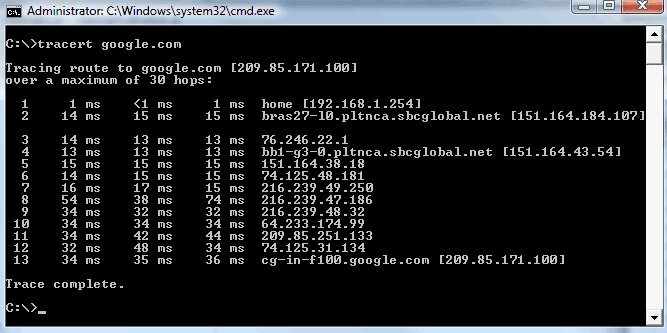
Traceroute exploits this error detection and reporting system to perform its feat. Traceroute will first send a packet to the destination with the TTL set to 1. The very first router on the path will decrement the TTL and return the Time Exceeded message, allowing traceroute to learn about the IP address of that first router–or hop, as it is often referred to. Traceroute will then send another packet with the TTL set to 2 and learn about the second hop. And it will keep doing that, incrementing the TTL each time until it eventually gets a response from the destination, telling it that it has been reached.
Traceroute will typically also measure the time it takes to get each successive response, allowing it to build a table of the response time for each hop. It will often also do a DNS lookup of each hop’s IP address to display each host’s FQDN instead of just their IP addresses in its results.
Traceroute’s Shortcomings
For the previous explanation, you’ll have figured that, due to the way it operates, traceroute will only show you the path towards the destination. It has, however, no way of discovering the return path. That could be a problem, especially in situations where the return path is somehow delayed. Traceroute measures the time it takes to get each response but it has no way of knowing if any delays were encountered on the way out to the destination or on the way back, potentially providing misleading results.
There’s also a potential problem with destinations that are load-balanced on several hosts. Nothing guarantees a traceroute user that each successive packet is sent to the same load-balanced host. And if the two hosts are in different locations, this could lead to inaccurate results.
Finally, for obvious security reasons some routers are configured not to respond to the type of requests that traceroute uses. This won’t stop traceroute from functioning and the utility will simply ignore those hops and report them as unreachable. However, some more advanced tools—such as Nmap—can use different types of packets for their path discovery, thereby mitigating the risk of unresponsive hops.
Introducing Nmap
Nmap, which stands for “Network Mapper” is a free and open-source utility for network exploration and security auditing. It was designed to rapidly scan large networks but it works just as well against single hosts. Nmap uses raw IP packets in novel ways to determine what hosts are available on the network, what services (application name and version) those hosts are offering, what operating systems (and OS versions) they are running, what type of packet filters/firewalls are in use, and dozens of other characteristics. Nmap is primarily used for security audits but many systems and network administrators use it for routine tasks such as network inventory, managing service upgrade schedules, and monitoring host or service uptime.
Here’s an overview of all that Nmap can be used for:
- Host discovery
- Port discovery / enumeration
- Service discovery
- Operating system version detection
- Hardware (MAC) address detection
- Service version detection
- Vulnerability / exploit detection, using Nmap scripts (NSE)
- Network path discovery (traceroute)
Nmap was created by Gordon Lyon (A.K.A. Fyodor Vaskovich) and originally distributed under the GNU Public License (GPL). Unsatisfied with some of the terms of the license, the authors eventually added clarifications and specific interpretations to the license where they felt the GPL was unclear or lacking.
Using Nmap For Traceroute
Using Nmap to perform a traceroute is super easy. All you have to do is add the –traceroute option to the command. For instance:
nmap 64.13.134.52 --traceroute
The –traceroute option can be used together with most types of Nmap scans except connect scans (-sT) and idle scans (-sI). The tracing is performed post-scan using information gleaned from the scan results to determine the port and protocol most likely to reach the target. All traces use Nmap’s dynamic timing model and are performed in parallel.
Contrary to the original traceroute utility described above, Nmap’s traceroute starts with a high TTL and then decrements it until it reaches zero. Doing it backwards (as compared with traceroute) lets Nmap employ clever caching algorithms to speed up traces over multiple hosts. On average Nmap sends 5 to 10 fewer packets per host, depending on network conditions.
A Few Other Traceroute Tools You May Want To Try
Traceroute (or tracert) and Nmap are not the only tools you can use to trace network paths. In fact, many tools are available from various vendors. Some claim to do it faster, some will succeed where others fail by using different ports and packet types to do their thing. Let’s review a few of the best traceroute tools we could find. It will give you an idea of what’s available.
The last two tools on our list are online tools. They essentially perform the same type of test as any traceroute, but they do it from an origin on the Internet. Most such services let you select the point of origin with the best ones offering options in multiple countries. Their primary use is in identifying how website users reach your site.
1. Traceroute NG From SolarWinds (FREE DOWNLOAD)
SolarWinds is a well-known name in the field of network management tools. The company makes some of the best monitoring tools starting with its flagship product, the Network Performance Monitor, a complete network monitoring solution. SolarWinds also has a solid reputation for making great free tools that address specific needs of network administrators. Traceroute NG is one such tool.
Traceroute NG leverages the SolarWinds Netpath technology to offer continuous TCP and ICMP tracing. It claims to be faster than other traceroute utilities and to return results in mere seconds. Of course, this mostly depends on the network.
- FREE DOWNLOAD: Traceroute NG from SolarWinds
- Official Download Link: https://www.solarwinds.com/free-tools/traceroute-ng/registration
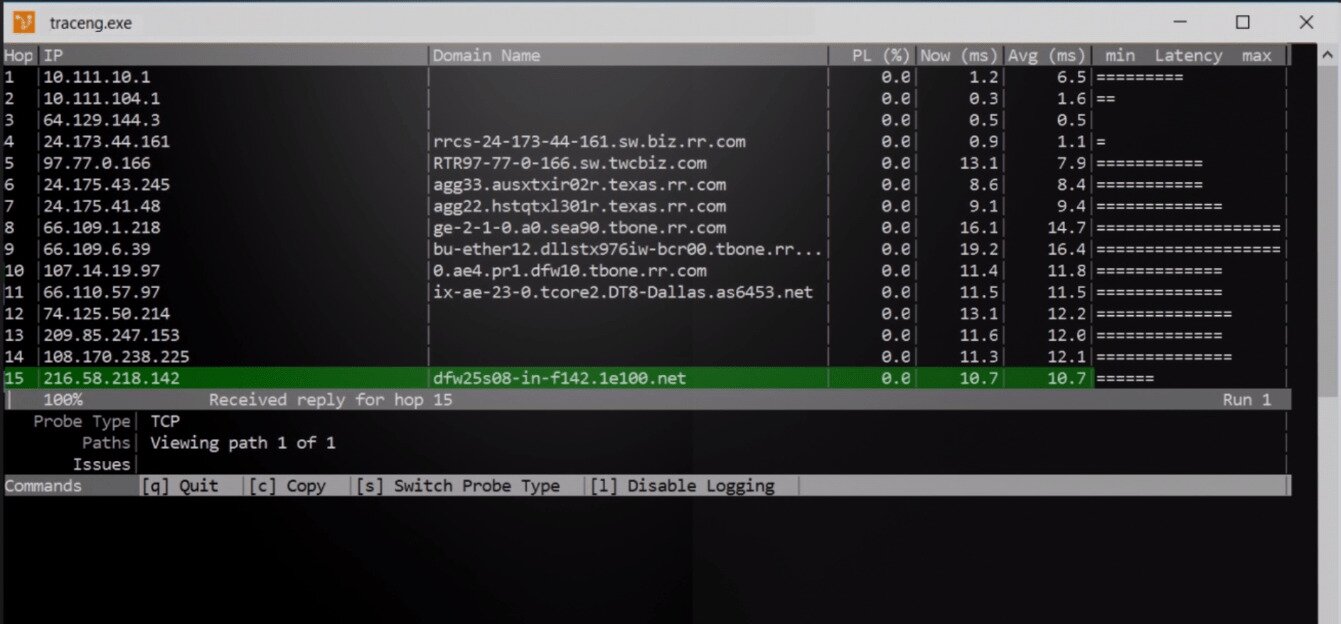
But Traceroute NG not only improves on the speed of traceroute. It also returns quite a bit more information, giving you a deeper insight into the situation. For each hop, the tool will use ping to return the packet loss percentage, the current and average response time as well as a latency bar graph. Also important, Traceroute NG will use a reverse DNS lookup to find and display the Fully Qualified Domain Name, or FQDN, of each hop.
Another great feature of Traceroute NG is its automatic detection of path changes. If there are multiple paths to a given host, the tool will figure it out and display each path individually. This is very useful when troubleshooting load-balanced environments. The tool will also let you choose to perform the test using either TCP or ICMP packets. This can be useful if some device along the path blocks ICMP, for example. And last but not least, this tool will write the results of its test to a .txt log file.
Traceroute NG runs on Windows only but, deceptively, it’s not a true Windows application. While it does run under the Windows operating system and is displayed within a window, it is mostly a text-based tool. But then again, would a GUI increase the tool’s usefulness? Probably not.
The tool, which is downloaded as a .zip file requires no installation but it relies on Winpcap which must be installed if it’s not already present on your computer. Traceroute NG, however, will detect its absence when it starts and will automatically launch the Winpcap installer which is included in the .zip file.
2. Open Visual Traceroute
If what you’re after is a true GUI-based traceroute tool, Open Visual Traceroute might be just what you need. The tool, which is available for Windows, most flavours of Linux, or Mac OS is simply amazing. And to make thing even better, the tool is free and open-source, released under the LGPL V3 license.
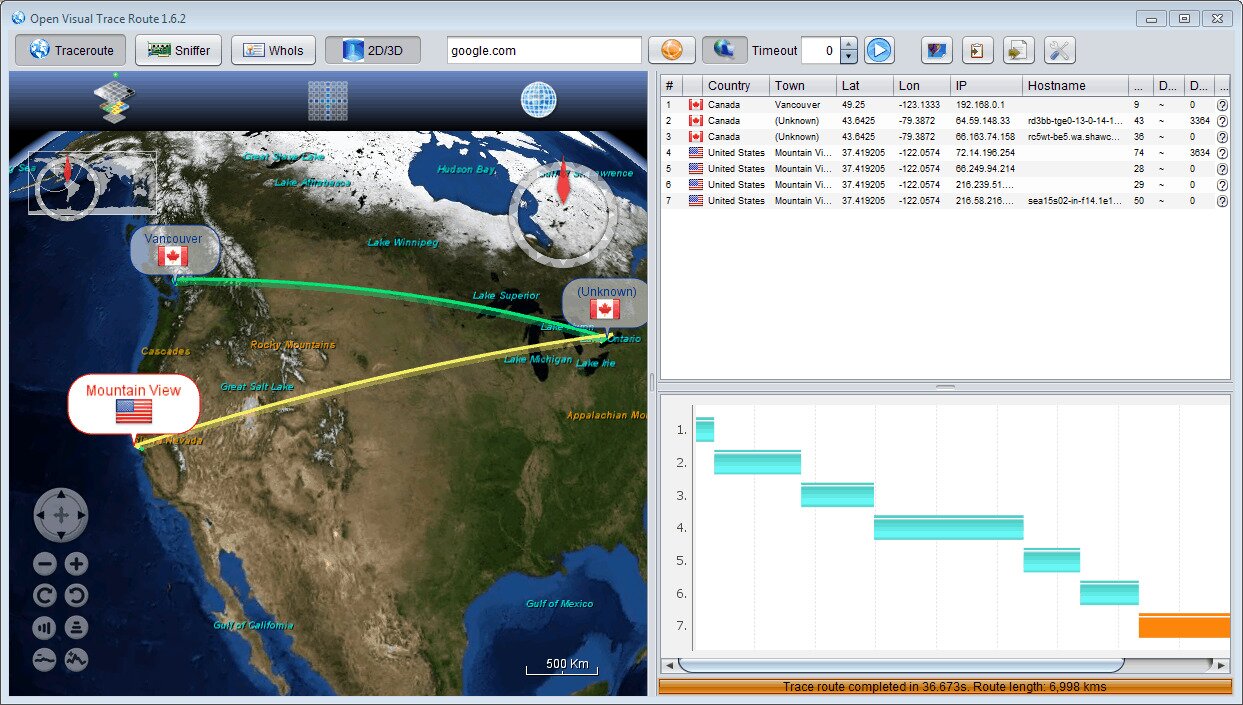
The main component of this software is the Visual Traceroute per se. It is a visual, GUI-based utility that will let you see on a World 3D map–or 2D if you prefer–what path the data is taking to go from your computer to the target host. The map can be zoomed and scrolled at will, providing any level of detail you might want.
Open Visual Traceroute also comes with a few more tools, making it an even more useful product. First, there’s a “packet sniffer”. It’s not a packet sniffer like Wireshark, though. Its purpose is solely to allow you to see what data is being sent back and forth from the local system to the Internet. There is also a Whois feature that will pull information about domain names from the Internet.
3. MTR (My Traceroute)
MTR was first developed by someone named Mike and the acronym stood for Mike’s Traceroute. Someone else has taken over and renamed it to My Traceroute but it’s still the same product. The software has been around since 1997. If its longevity is a testament to its quality, this ought to be a pretty good tool.
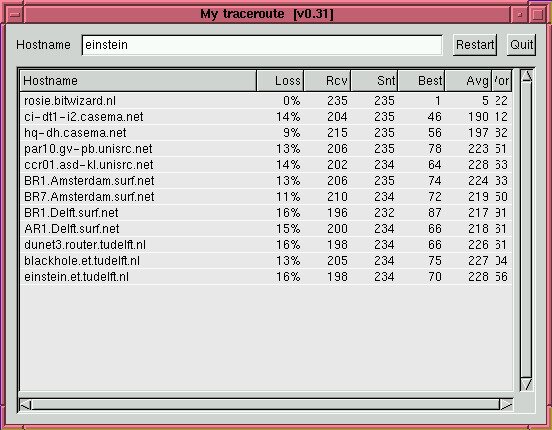
And it is. Functionally, it is almost identical–or at least very similar–to Traceroute NG reviewed above. The main differences between the two are that while the former is a Windows application, MTR runs on Linux and can be used with a GUI or from the command line.
Concretely, MTR combines the functionality of traceroute and ping in one network diagnostic tool. When you run the software, it first operates exactly like traceroute to learn the network path to a specified host. Once it knows the path, the tool can go a bit further. It will send a sequence of ICMP ECHO requests to each hop to measure the quality of the link to each router. And as it does that, it displays the measured statistics on the screen. In fact, it prints it to the standard output, meaning that it can be redirected to a file.
4. Monitis Online Visual Trace Route Tool (Online Tool)
Monitis is a TeamViewer company that makes a well-known website performance monitoring platform. The cloud-based virtual service will allow you to monitor your websites, servers, applications, and more anytime and from anywhere. With close to a quarter-million users, this is a rather popular platform.
Like many other vendors, Monitis has a few free tools available on their website. The Online Visual Trace Route, despite the unusual spelling, is exactly what it says it is. It will trace the route between Monitis’ server and the host you specify and plot it on a map of the World. Unfortunately, the map display rarely includes all hops. This is normal as the tool won’t be able to geolocate every hop and some hos won’t respond at all. And this is true of any such tool, not just this one.
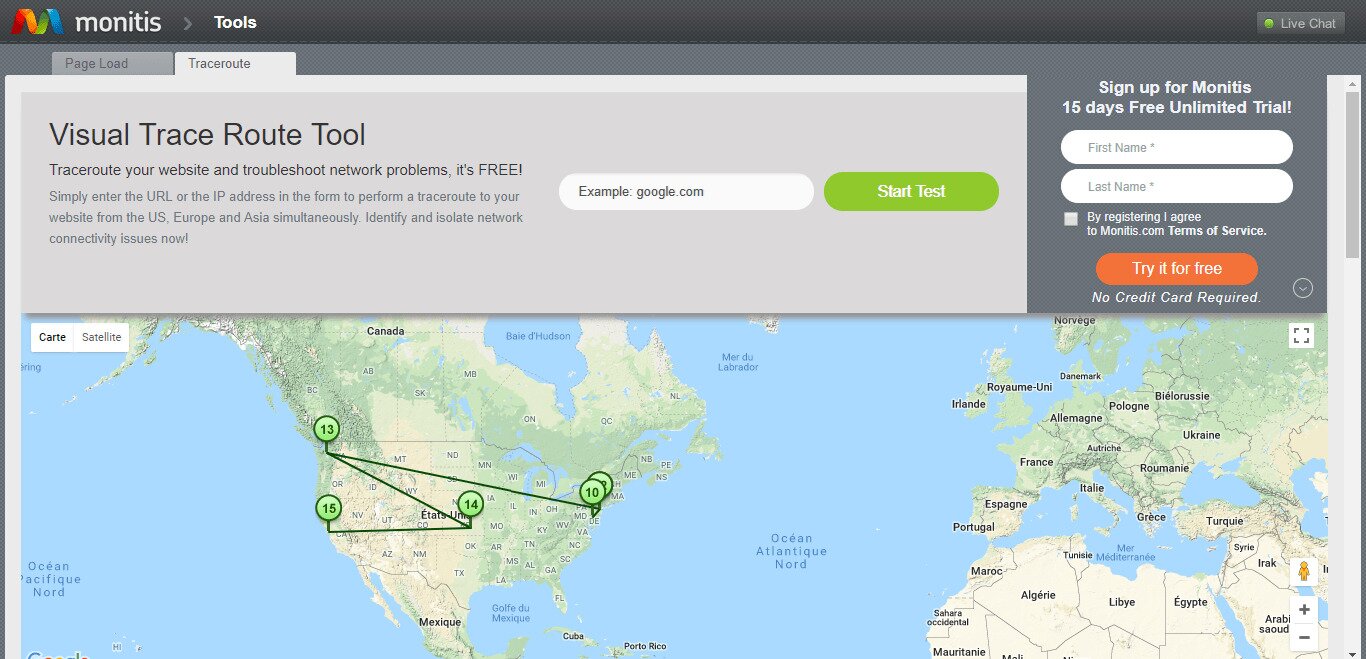
If you scroll down the screen, you’ll see that the tool also present the information in a tabular form, much like a traditional traceroute tools would. You might also notice that, at the top of the tabular display, there are three tabs labelled United States, Europe, and Asia/Pacific. You’d be lead to think that clicking on a tab runs the test from a different source located in those three geographic areas but, looking at the results, it doesn’t seem to be the case. Both the table and the map display change from one tab to the other but I haven’t been able to figure out how they operate.
5. G-Suite.Tools Visual Traceroute (Online Tool)
Don’t let yourself get fooled by its name, G-Suite.Tools is in no way related to Google. The website proposes a handful of useful network and Internet tools. Among those is a visual traceroute tool. Using it is pretty simple. You simply type in an IP address or FQDN and click the TRACE button. Pretty soon, a smallish map on the page will visually display the path to the specified host.
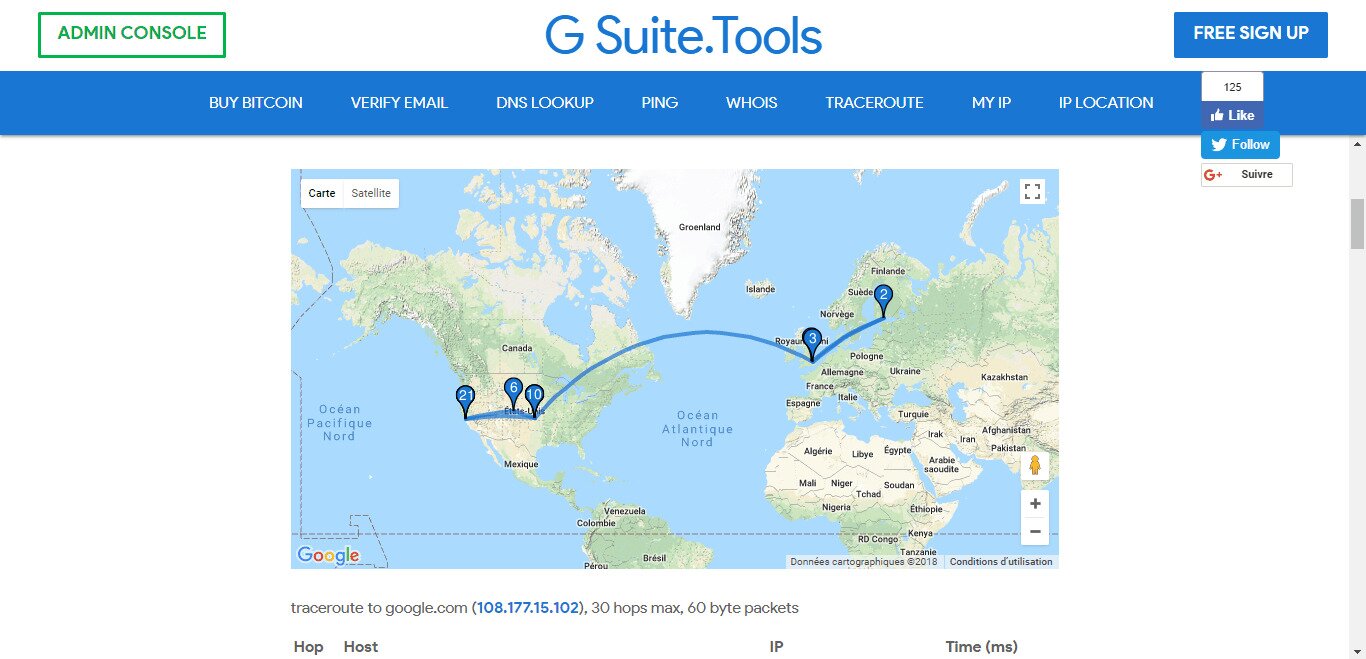
Like most other similar tools, a table is available. It shows IP address and FQDN (when resolvable) as well as the cumulative round-trip time to each hop. One thing we particularly loved about this tool–and it is particularly well-suited for newcomers–is the wealth of information about the traceroute process that can be found on the page.
While you’re there, G-Suite.Tools has a few other tools you might want to use. Each can be easily accessed from a ribbon menu at the top of the page. There’s DNS Lookup, Whois lookup, ping, my IP address, IP address location as well as a tool to verify the operation of email addresses.