Diagnosis: Monitor Real-Time Resource Usage By Individual Android Apps
There are lots of system and activity monitoring apps in the Android Market, such as Cool Tool, Elixir 2 and Android System Info, but not all display real-time statistics pertaining to consumption of various system resources by individual apps, and that too via a customizable, persistent on-screen panel. Enter Diagnosis; developed by XDA member Dark3n, Diagnosis helps you find exactly how much system and network resources are being consumed by the operating system in general, and each running app. In addition, the app keeps a close tab on all the core components of your Android device, including battery, CPU, memory, network traffic and apps, maintains a statistical usage history of each, and provides you with a chance to customize and select from as many as ten different styles for the on-screen panel.
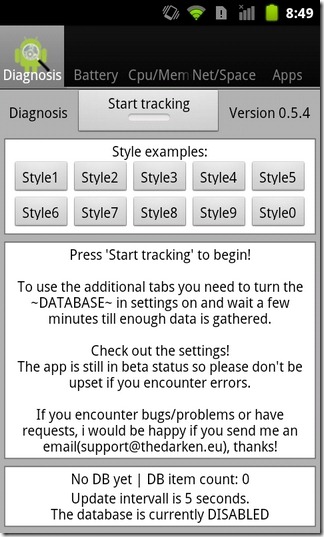
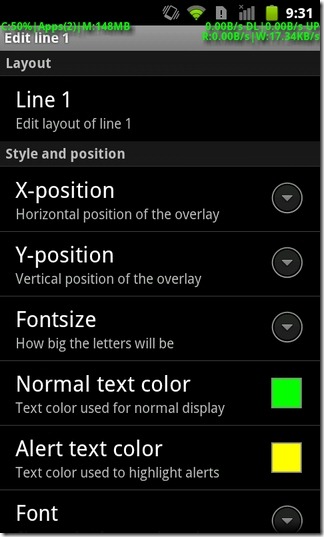
The app’s homescreen comprises several tabs, namely Diagnosis, Battery, Cpu/Mem, Net/Space and Apps. The on-screen information panel can be toggled by hitting the Start tracking button on the Diagnosis screen. Various buttons under the Style examples menu can be used to switch between different display styles. The panel is visible throughout the OS. Apart from displaying the exact app count, the panel also shows total CPU and RAM usage, and total data uploaded/downloaded by a particular app.

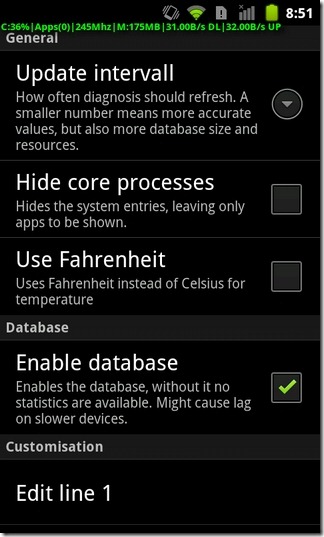
To activate other tabs, and enable logging information under each, you must select the Enable database option from within the app’s settings screen (Menu > Settings). From the same screen, you can also change the time interval after which the app updates all its data, Hide core processes (system apps) from being displayed within the panel, and choose the default temperature unit (Celsius and Fahrenheit).
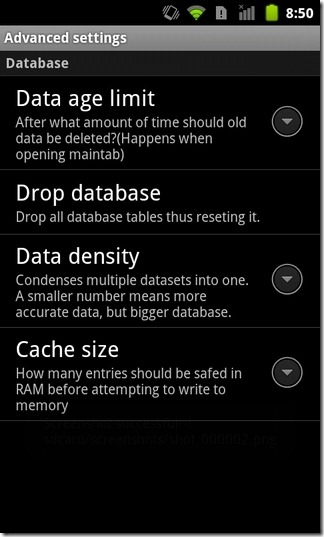
Under the Customization menu, there are as many as four different layout templates that you can tweak in order to redesign and reposition the on-screen panel to your liking. The last option on the settings screen, Advanced settings, can be used to adjust database settings, such as specifying the time after which the app deletes recorded data, allocating the app’s cache size and resetting the database.
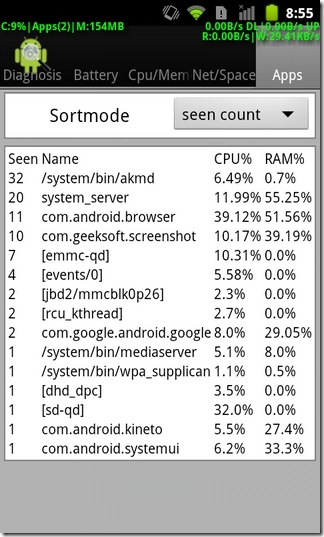
The app helps you determine whether a running app is hogging too many resources or mobile data. Whichever app stretches the CPU usage past 40% gets displayed on the panel.
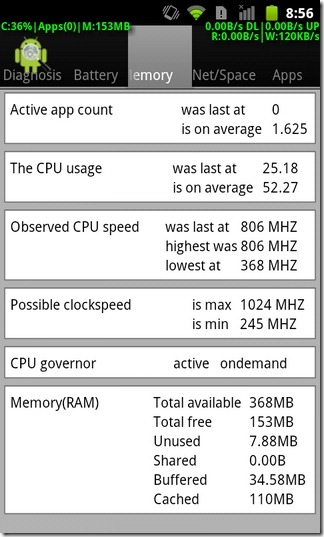
The Battery tab displays comprehensive information pertaining to the current battery status, health, charging level, temperature, make/model and voltage etc. The Cpu/mem tab keeps a detailed log of CPU and RAM usage, Active app count, highest, lowest and last recorded CPU speeds, and possible clockspeed (maximum possible overclocking of your device’s processor).
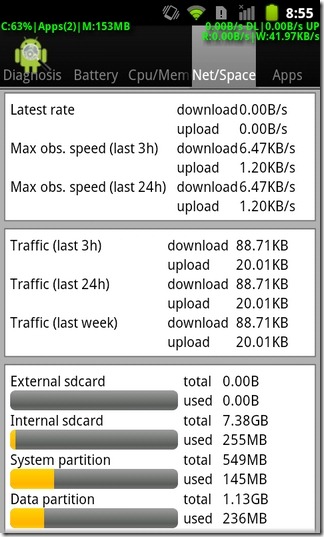
While the Net/Space tab gives you a breakdown of the total storage space and bandwidth consumption, the Apps tab lists all the active apps sorted by their CPU and RAM usage (in percentage).
All in all, a handy tool for budding developers, beta testers, avid gamers and users who’re curious about how their devices perform under heavy load.
Download Diagnosis – System Information for Android
