Excel 2010 Icon Sets
In Excel 2010, there is an option which facilitates user to show icons in data cells by applying desired condition. Excel includes 20 Icon Sets in four categories; Shapes, Directional, Indicators, and Ratings, and along with this it also enables user to easily format and customize the icon sets to make data cells prominent, which shows an exclusive importance. In short, by using Icon Sets you will have more control over the visualizations in the worksheet data. This post covers how to include icon sets in the datasheet.
Launch Excel 2010, and create the new datasheet or open the existing one.
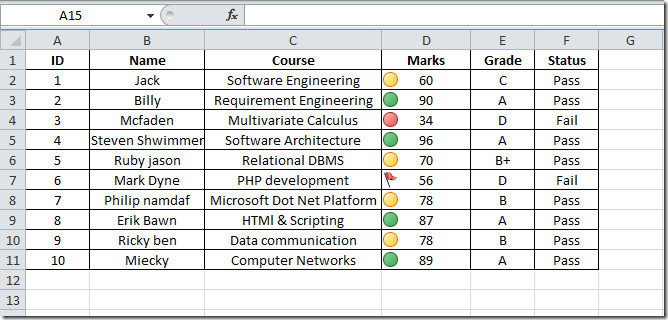
For Instance, we have included datasheet of student record on which we want to apply icon set with specified rule.

First you need to categorize your column data with some rationale. In this case we are considering three categories.
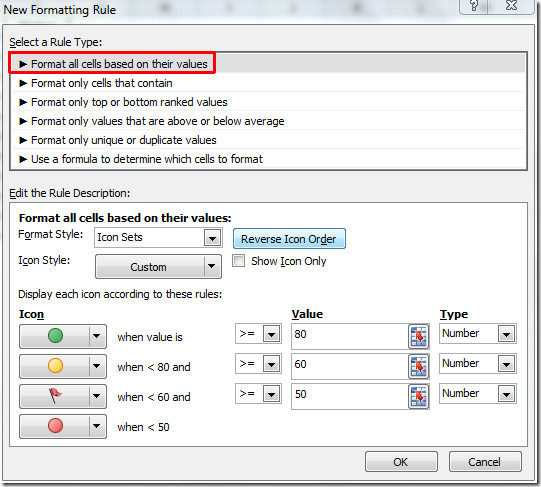
- Marks greater than 80
- Marks between 80 and 60
- Marks between 60 and 50
- Marks less than 50
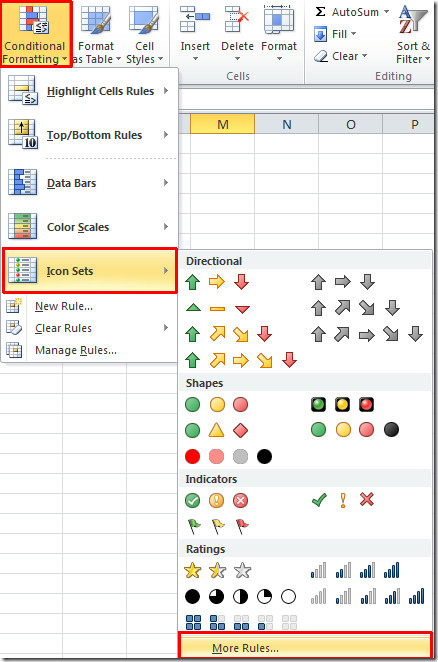
Now we want to show icon with each cell in the column, falling in to above mentioned categories. To start off with it, select the column on which you want to show Icon Sets, navigate to Home tab, from Conditional Formatting go to Icon Sets menu, and click more rules as shown in the screenshot below.

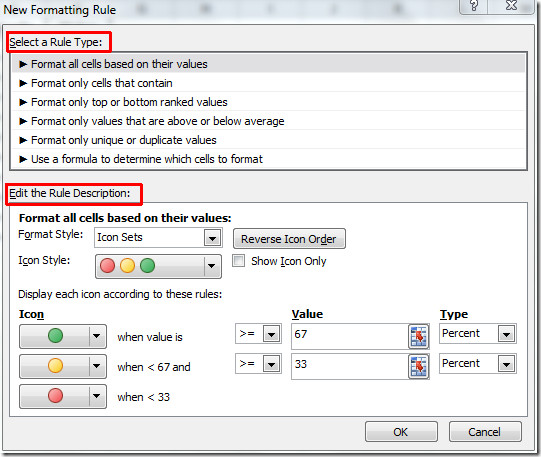
You will reach New Formatting Rule dialog, now under Rule Type go through the options and select an appropriate one. From Rule description you can define rule in detail and assign suitable icons set for it.

Under Edit the Rule Description, you can select icon sets from Format Style, if you want to show only icons in the cells enable Show Icon Only option. Under Icon pane, you need to associate icon with each category.
In our case, we will select format all cells based on their values from Rule Type, Under Icon pane ,we need a set which contains four icons, so we can apply icon with each category, as shown in the screenshot below. Click OK to apply rules over the selected column.

You can see the icons with each data cell as shown in the screenshot below.

You can also checkout previously reviewed Sparklines in Excel2010 and Goal Seek.

how to use the icon for -53% as decrease and 13% as increase
How do I get these stupid icons out of my spreadsheet. All they do is cover the information I’m trying to work with
Fine but I want to use my own icons, such as the ones used for weather forecasts.
ICON SETS
—————-
Under Icon style drop-down menu, ‘Custom’ choice isn’t showing up.
I am using MSEXCEL 2010