Excel 2010: Add/Change Chart’s Gridlines
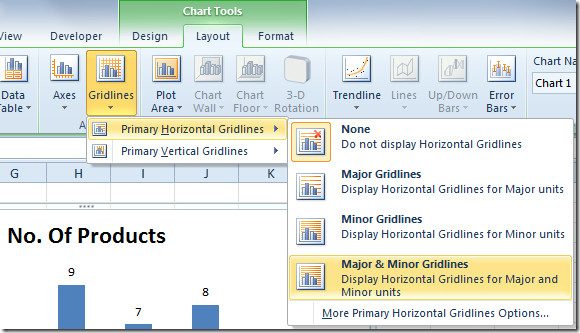
You can show either Major or Minor or both types of Gridlines on a chart in Excel 2010. These three types of grid lines assist in scaling the chart against set parameters. If you’ve created one huge chart, you may need to insert gridlines for correctly measure every data point with it. To do so, select the chart and navigate to Chart Tools Layout tab, in Gridlines pull-down menu, from Primary Horizontal Gridlines options, select a desired type which you wan to insert.

Now from Gridlines options, select a Vertical Gridline type to insert gridlines at Y-axis.


Excel 2010 is a piece of crap
May I know how to make the grids smaller?
Your solution looks good. Elegant. One issue though: I do not seem to get it to handle negative numbers the right way. As long as it stacks positive numbers it works like a charm. The waterfall chart is best however when it is possible to show that some values goes up and some go down.
This is such a PAIN compared to older versions of Excel! Been trying for 1/2-hour–STILL can’t get my worksheet to format the way I want. Would’ve taken me literally five seconds on older versions. Arrrrggh!