Excel 2010: Add Trendline in Chart
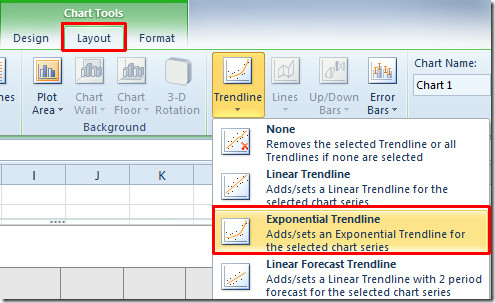
Excel 2010 includes Trendline which is a great data visualization tool to show the trend of specified data range. There are three kinds of trendlines; Linear Trendline, Exponential Trendline, and Linear Forecast Trendline. This post covers how to apply trendlines over the chart.
For inserting trendlines in chart, select a chart and navigate to Chart Tools Layout tab, From Trendline options, select a required type.

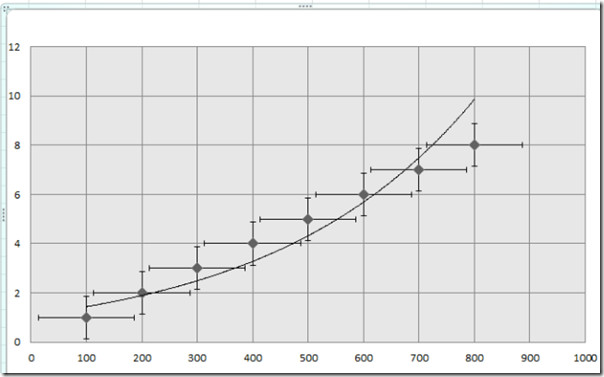
It will instantly insert trendline of specified type.


what if he TRENDLINE item is grayed out
Thanks – I even looked at the layout tools before searching and didn’t see it – duh!
Great!! Thank you!