Create Diagrams In MS Visio 2010 By Linking Excel Spreadsheet
Microsoft Visio is an excellent Vector-Graphic software, carrying a lot of tools, functions, features and most importantly thousands of diagram types for creating generic diagrams, chart flows and designing system architecture. Like it’s counterparts, Microsoft Visio 2010 has also been augmented with some advance features, tools, and diagrams. In this post we will be covering data link feature which will let you collaborate with Excel 2010 spreadsheet, eventually simplifying diagram creation procedure by linking directly with selected spreadsheet.
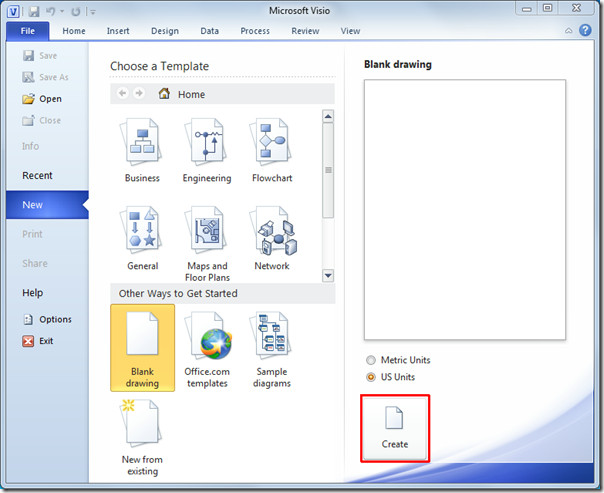
To begin with, launch Visio 2010 and for creating a diagram from scratch, in backstage view, click Create.
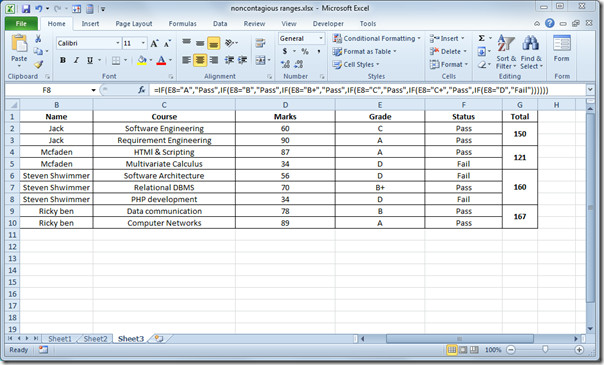
As we are inserting Excel 2010 spreadsheet into Visio for collaboration, we have created a student record in Excel spreadsheet having fields; ID, Name, Course, Marks, Grade, Status, and Total.
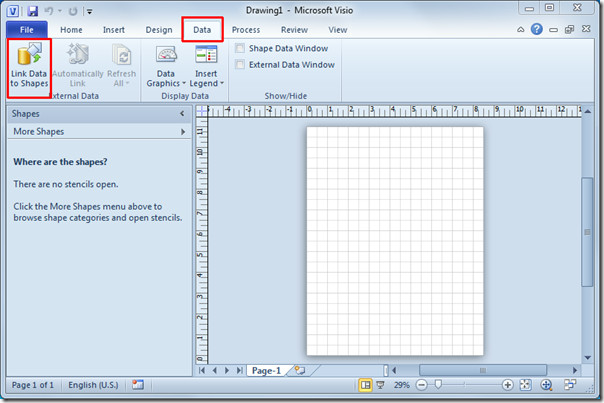
In Visio 2010, navigate to Data tab and click Link Data to Shapes button.
It will bring up Data Selector wizard, select Microsoft Office Excel workbook and click Next.

In this step, click Browse and select the Excel Worksheet which you want to insert for depicting data values in pictorial representation. Click Next to continue.

Select the Excel worksheet which you want to include. You can also select range, by clicking Select Custom range. We will also enable first row of data contains column headings option, as in our case first row of Excel spreadsheet contains column headings. click Next to continue.

Now select columns and rows which you want to include, click Select Columns and a dialog will appear showing all the columns in specified worksheet. Disable unwanted columns title and click OK.

For inserting specific rows repeat the procedure to insert desired rows. You will see the selected columns and rows in the wizard dialog, now click Next to proceed further.
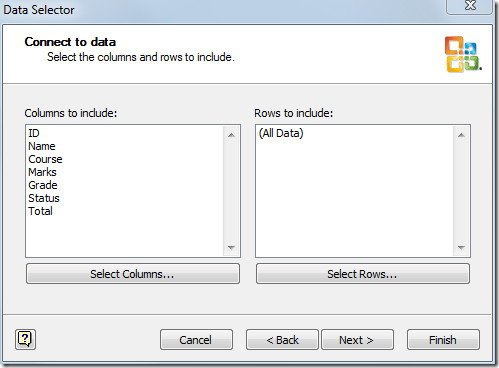
This step is about selecting a column or row, which contains unique identifiers, i.e, unique value, as inserted Excel sheet has an ID field having unique values, so we will select ID field. Click Finish to end the wizard.

In the bottom of Microsoft Visio window, you will see the inserted Excel spreadsheet containing selected rows and columns.

Now you have to select the diagram type, for this, from More Shapes options, select the desired type of diagram. For instance, we are selecting Activity diagram which has been widely used for depicting software module’ activity. It falls in UML(Unified Modeling Language) category, which further contains a lot of software specific diagrams.
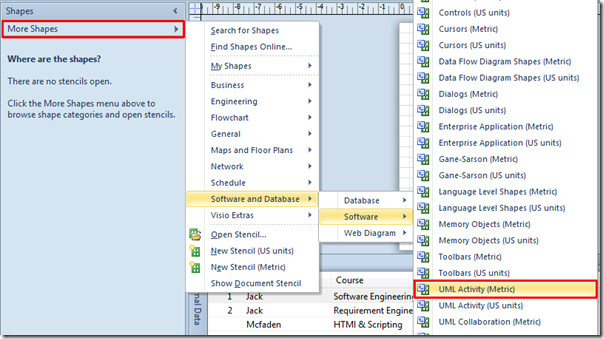
Upon selection, you will see all corresponding shapes contained by specific type of diagram. As for UML Activity, it shows all the shapes which are essential to make an activity diagram.
Now select Initial State shape from the list and drag it over to main diagram area.
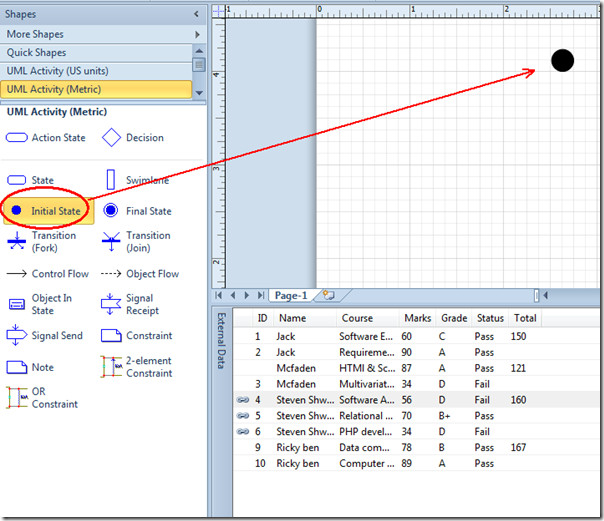
Select Action state and start dragging specific rows from inserted Excel worksheet into diagram. As Excel sheet is linked with the diagram, it will automatically show you the related Data Graphic (data value) with shape.
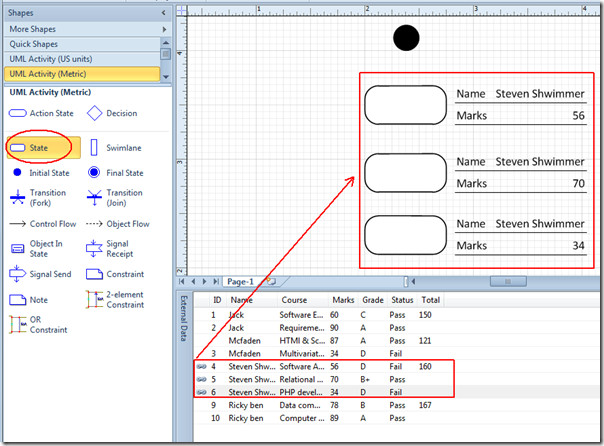
For changing Data Graphic, right-click the inserted shape and from Data options, select Edit Data Graphic.
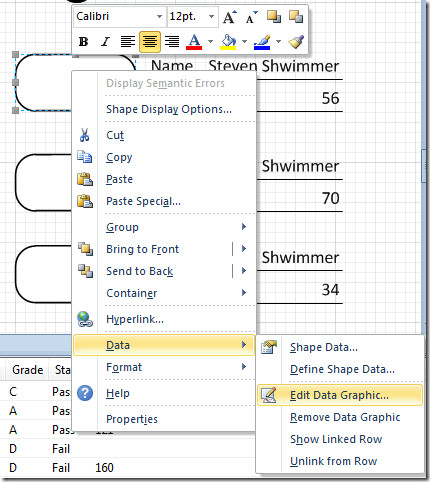
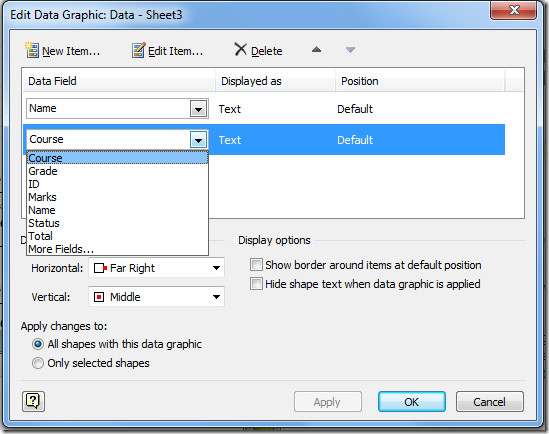
In the Edit Data Graphic dialog, inder Data Field you can change field which you want to show with inserted shape. For example, if you want to show the Name of student and Course, select the respective fields from drop-down list.
You don’t have to change it for each shape, it will automatically apply changes on all the inserted shapes. Once done, click OK to return.
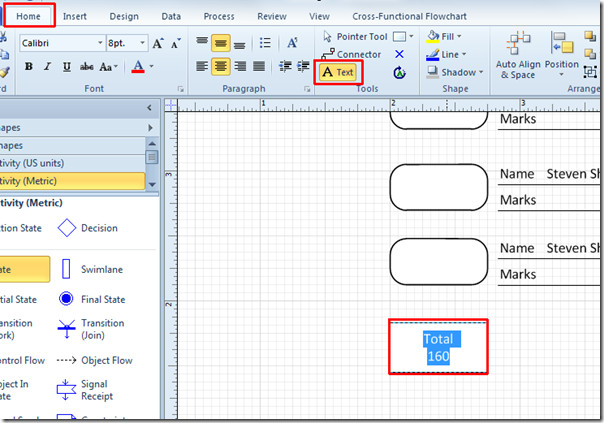
To give you the generic idea, we are just depicting one student record in UML activity diagram, now we will manually add a State shape showing total marks secured by student. Drag the State shape in to main diagram area, navigate to Home tab and click Text, to add text in it.
Now start connecting shapes with Control Flow shape, select it from left sidebar and drag it over to main diagram window.
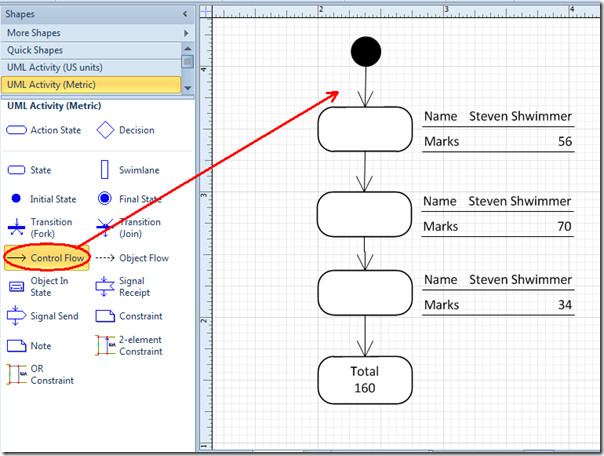
By following the above procedure, you can make a diagram in Microsoft Visio 2010 out of any Excel datasheet, rather than looking up values in Excel spreadsheet and entering them in diagrams.

What if your excel worksheet has a list of tables and their columns? That is how I map out a database schema, and now I’m trying to bring that into have Visio, and have it create the shapes based on the table/field list. Is there a way to do that? eg
table field data type
table1 ID int
table1 txtname varchar(400)
table2 ID int
table2 FKPerson int
table2 dtOrderReq datetime
I can draw the relationships, if I can get visio to create each of those tables, with their fields set up. Looking to automate that part of it.
Thanks!
Creative post , Incidentally , if your company is searching for a AAR Residential Lease Agreement , my boss filled out and faxed a template form here http://goo.gl/EYVgJm
Do you know how to create the drawing automatically without having to drag the data on to the drawing? Is there a way to do this based upon a template? Here is the example that I want:
– Export data from a custom asp.net mvc application into excel worksheet
– user saves data on their drive
– user opens up visio and based on the template can create the drawing from the excel data without any further interaction.
Do you know if this is possible?
I did download visio beta….but i want these sample files u made in Visio n Excel 2010…i have tried linking exel & visio but in vain….:(
Brilliant Post! Thanx a zillion….
Can i have these visio & excel files…. just checked u guyz on google n seems like you guyz coverd up whole office 14…Awesome
We are glad you are liking our guides. You can download Office 2010 beta from here: http://www.microsoft.com/office/2010/en/default.aspx
Visio and Publisher beta versions are available separately.
I think he meant that he wanted the example files that you created.