Ubuntu’s Baobab (Disk Usage Analyzer) Shows Graphical Tree Map Of Directories
Disk usage is one of the primary concerns for Linux users as many Linux distributions come with a large amount of applications, many of which you might never use. Moreover, many directories and subfolders can end up consuming a large chunk of your disk space and it becoms difficult to identify folders consuming the most disk usage. Boabab Disk Usage Analyzer is a GUI based application which comes with Ubuntu distributions to analyze disk space utilization. It is designed for the Gnome based desktop environment and for this reason is also available for a number of other Linux distributions. It can scan the whole file system tree and selected folders to display information about the disk used by specific directories. The disk usage analysis can be performed for both local and remote computers. The disk usage information can be viewed in the colored ring or tree charts. Since some users may find the subfolder structure display and disk analysis a bit confusing to understand using Baobab, for this reason, we are providing you with a complete overview of Baobab (Disk Usage Analyzer) to help you identify unwanted folders which may be eating up your disk space.
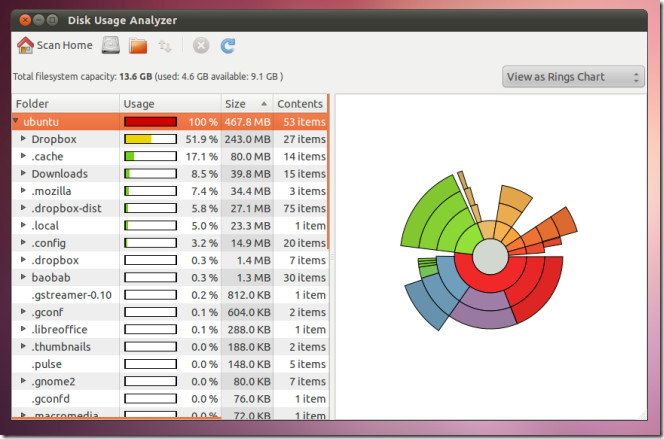
To get started, launch Disk Usage Analyzer and either select a directory to scan or select Scan File System option to initiate a full system scan. The second pane on the main interface instantly starts constructing a map of your disk usage as your system files and folders are scanned. Disk Usage Analyzer displays actual disk usage of each directory and not the file size. If you want to view the folder size, uncheck View → Allocated Space.

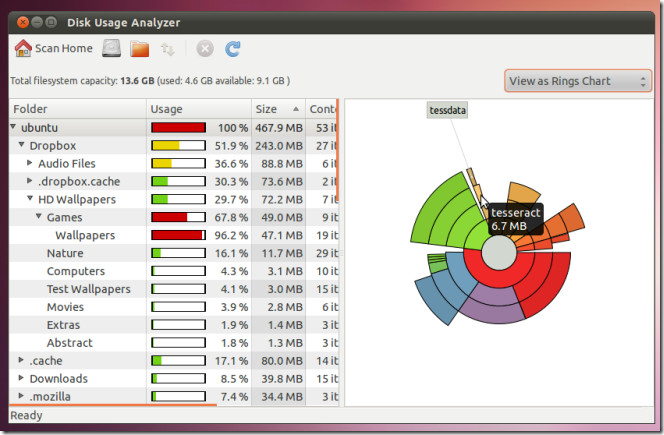
Each subfolder is displayed as a sector of the ring with a proportional angle to the size of the host folder. The sub-folders are shown in different colors (lighter colors) to make visualization convenient. Sub-folder representation depth is displayed up to a maximum of five levels, with the black level on the chart representing the folders with the most depth.

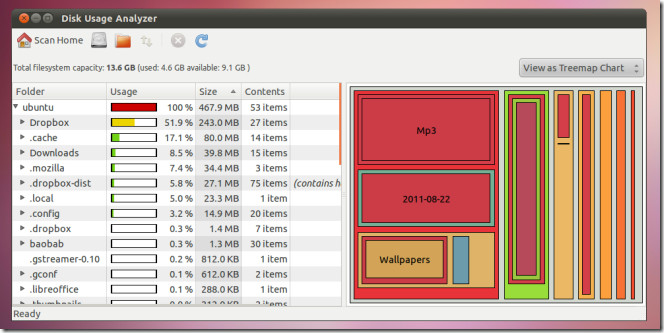
You can toggle chart visibility from the drop down menu located on the right-hand side. The Tree layout displays the same information in the form of square and rectangular graphs. The subfolder visualization is displayed in the same way as the ring charts with up to five maximum levels.

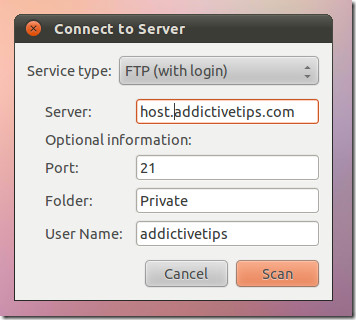
You can also analyze disk usage of remote machines. To do so, click the arrow icon button from the toolbar and select a server type (FTP, Public FTP, SSH, Windows Share, WebDAV (HTTP), Secure WebDAV (HTTPS) or Custom Location) and enter your login credentials.

Baobab comes built-in with latest Gnome distributions and is available via the Ubuntu Software Center. Gnome users with older Linux distributions can download and compile he source package from the Launchpad link given below.
Download Baobab Disk Usage Analyzer

baobab