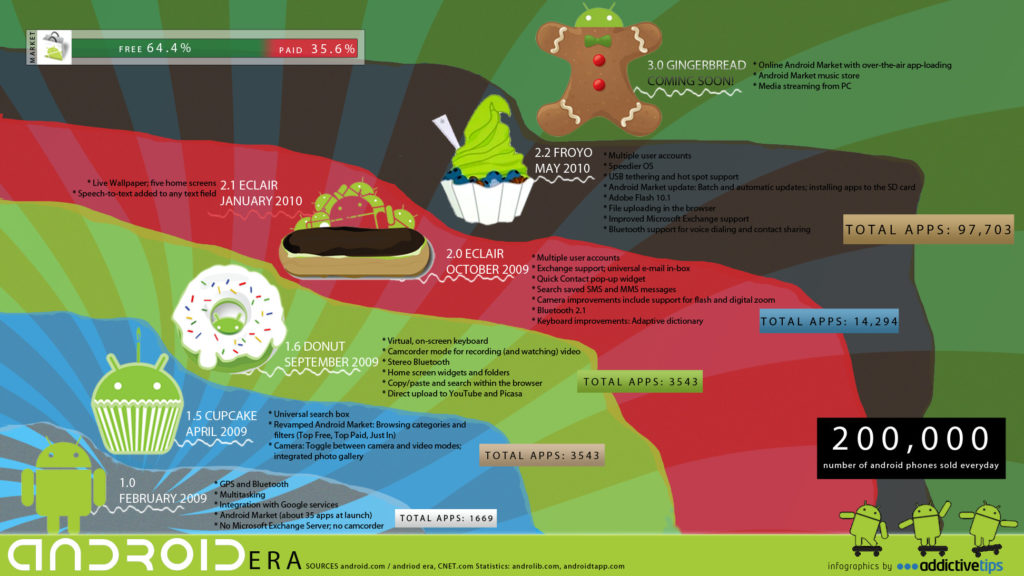
The Era of Android [Infographic]
At AddictiveTips, we will bring you one infographic every week. Infographics or Information graphics, give a better insight into the current trend by depicting the information visually. We believe infographics can present complex information more clearly and comes useful where long articles have failed to provide a clear understanding.
Today we bring you an infographic named “AndroidEra”, which shows the Android versions, features, and the total number of applications in the Android Market since February, 2009.
Corrections: Android 1.0 was released in September 2008, rather than February 2009; it received its first update to 1.1 in February 2009. Secondly, at the time this infographic was designed, speculation was that the version after 2.2 Froyo would be 3.0 Gingerbread. However, as we all know by now, Gingerbread was given the version 2.3 upon its release, rather than 3.0.

As you can see, Android has seen immense growth as a platform. Starting with its first public 1.0 release in September 2008 on the T-Mobile G1 (HTC Dream) and after receiving the 1.1 update in February 2009, it has made its way through 1.5 Cupcake, 1.6 Donut, 2.0 and 2.1 Eclair, 2.2 Froyo and 2.3 Gingerbread to become one of the most widely used smartphone operating systems in the world, second only to Apple’s iOS (used in iPhone/iPad).
With the growth of Android, there has also been a lot of growth in the Android Market. Starting with a bunch of apps two years back, Android now boasts the second largest app platform in the smartphone world, after Apple’s iOS, with nearly 100,000 apps before the launch of Gingerbread.
Lastly, the figure on the number of daily Android phone sales is also phenomenal and at this growth rate, it will be safe to project that within the next couple of years, Android may very likely oust iOS as the most widely used smartphone operating system in the world.

Actually Gingerbread should be 2.3 🙂
Honeycomb is 3.0.